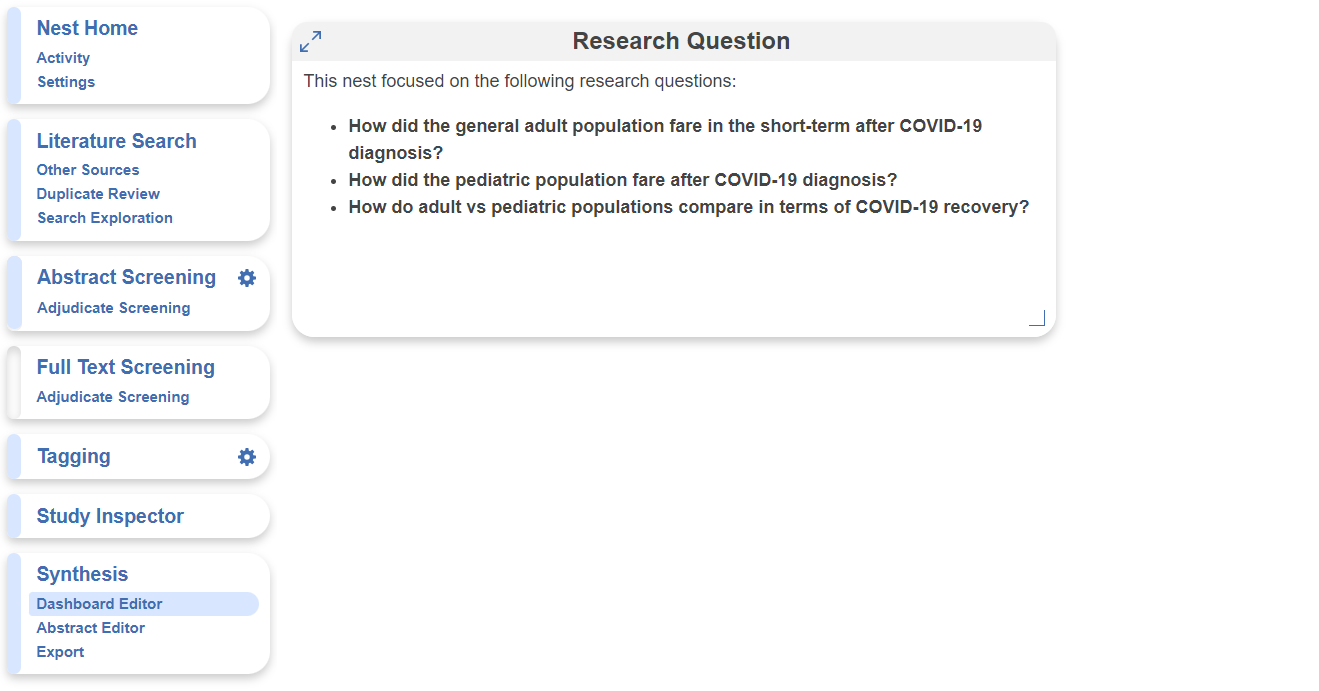
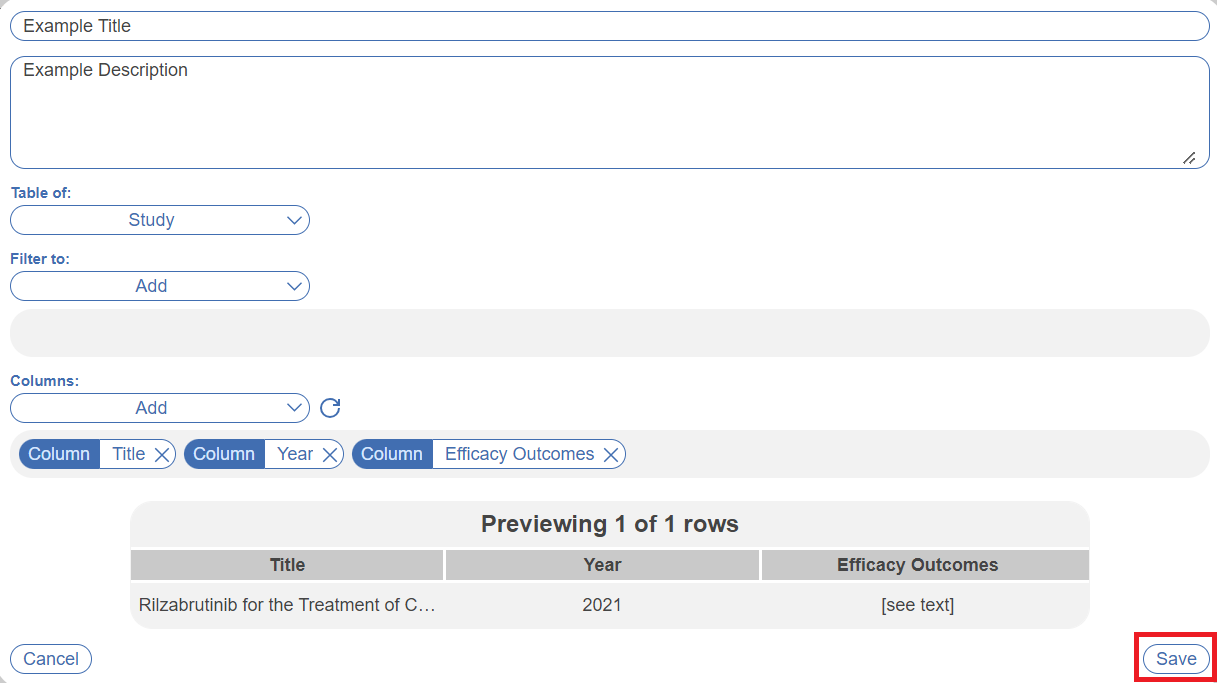
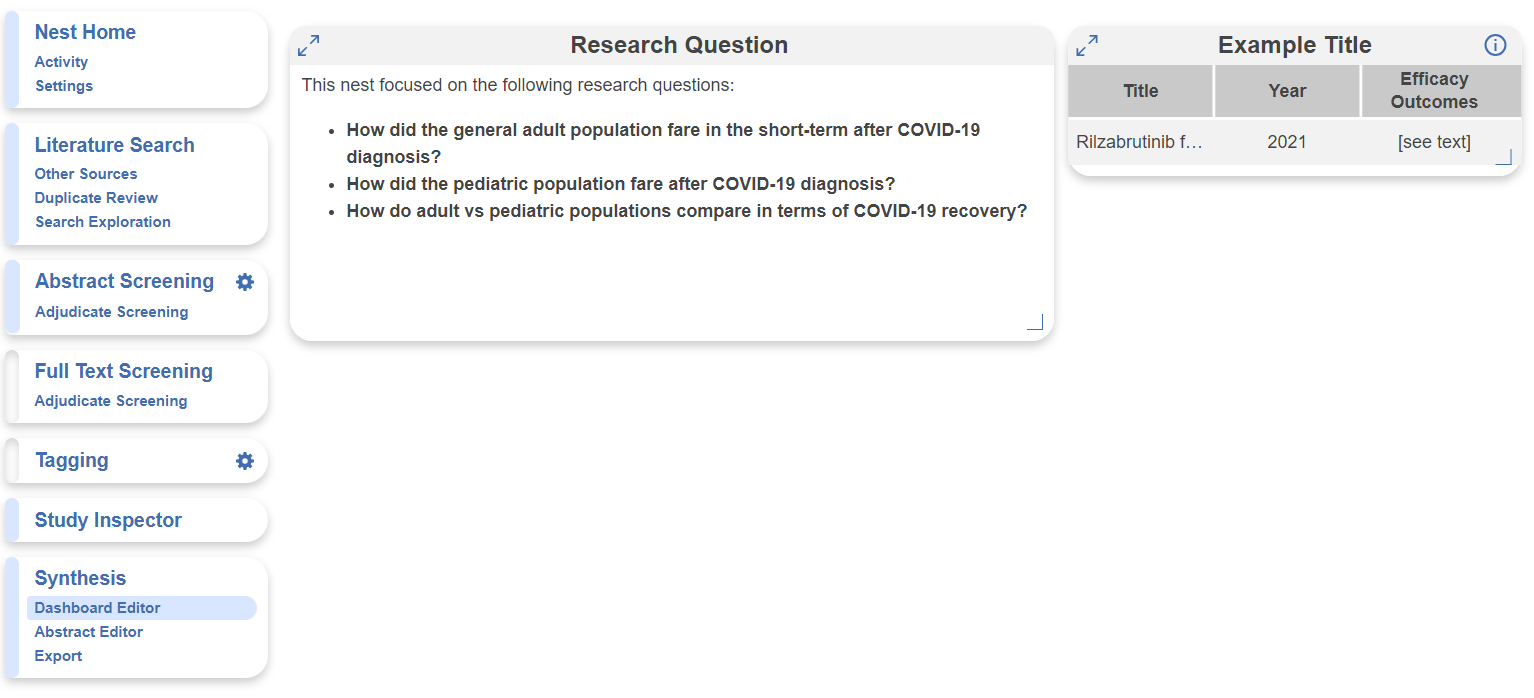
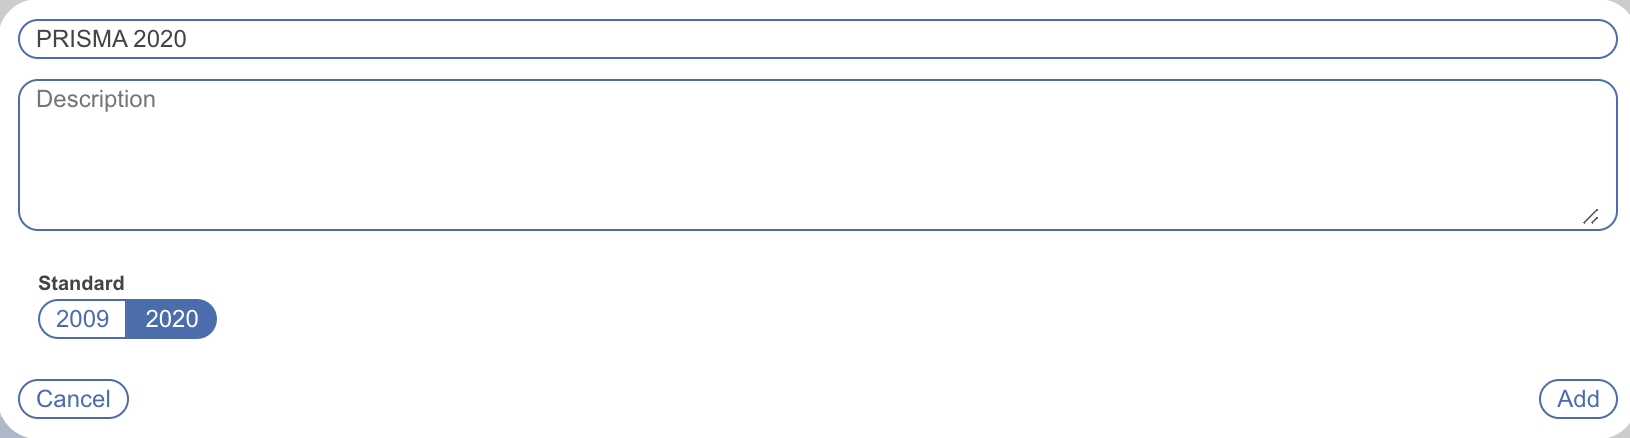
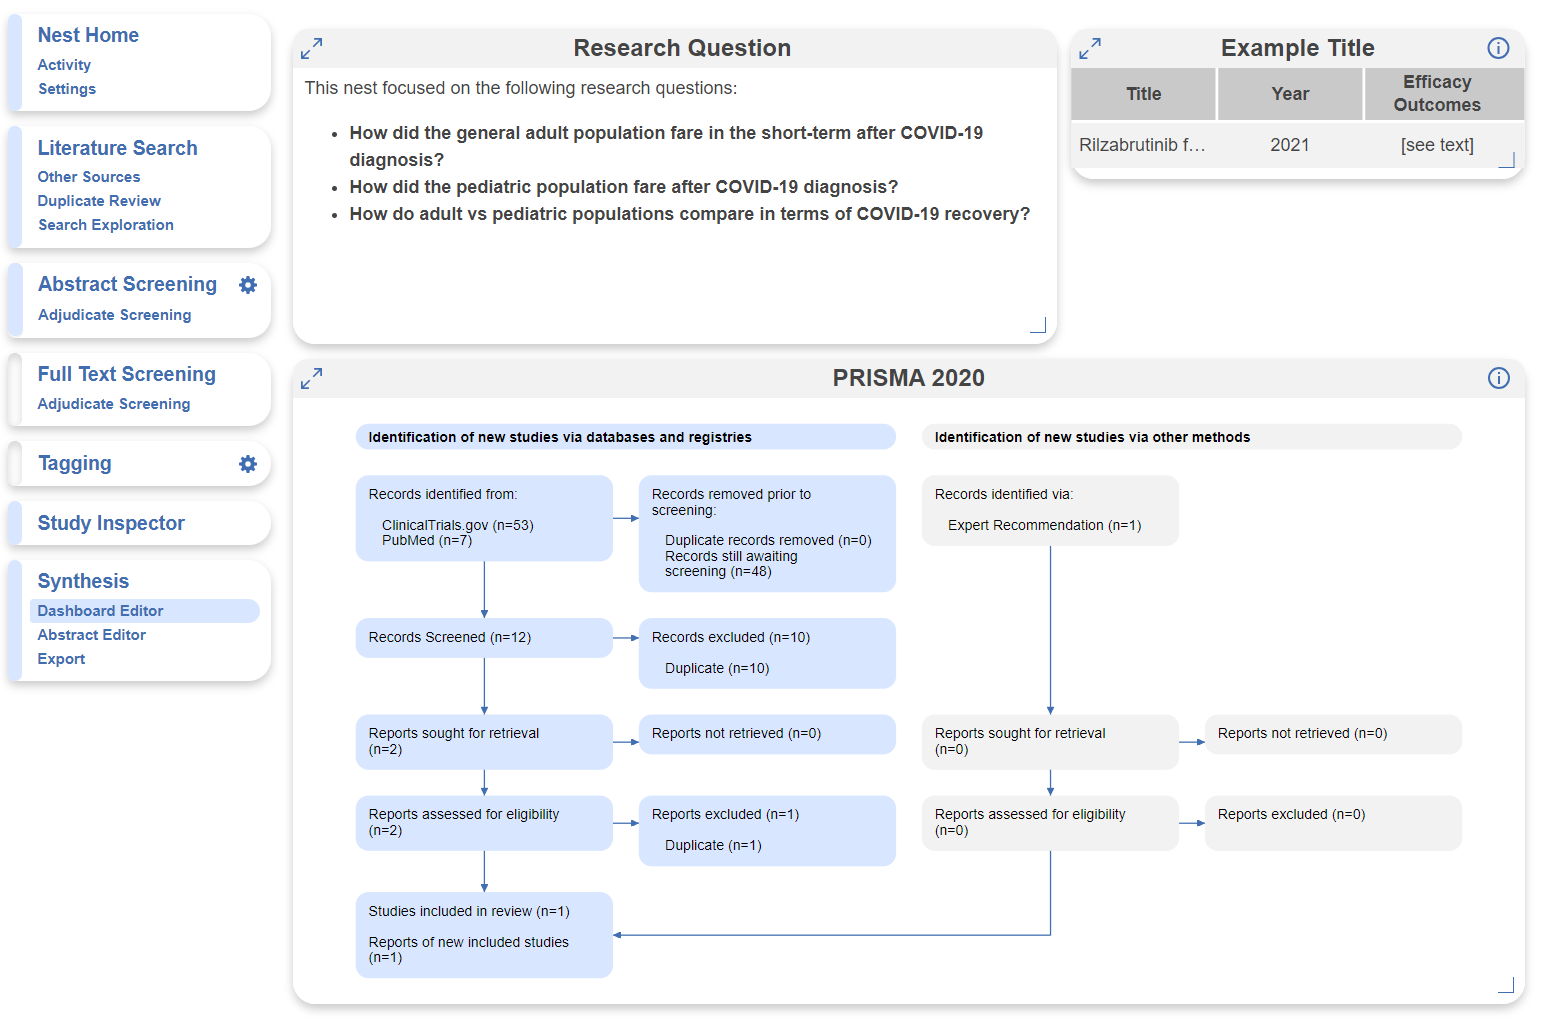
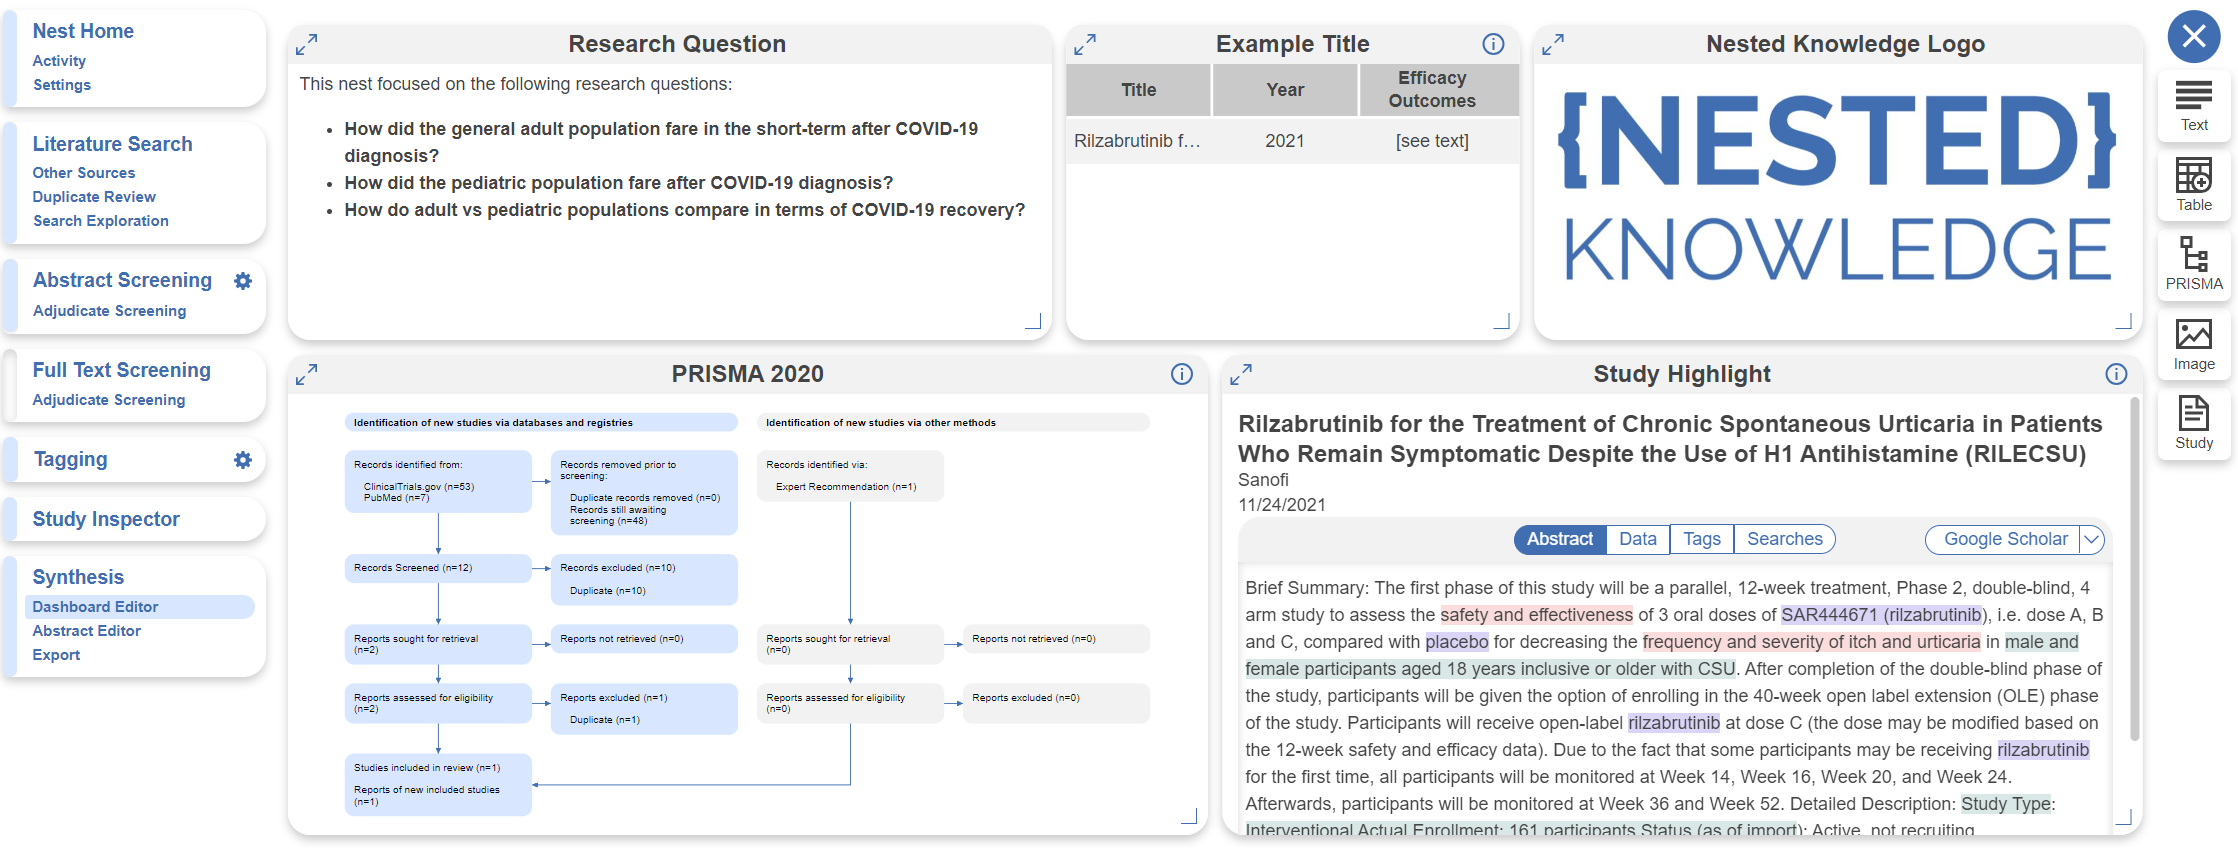
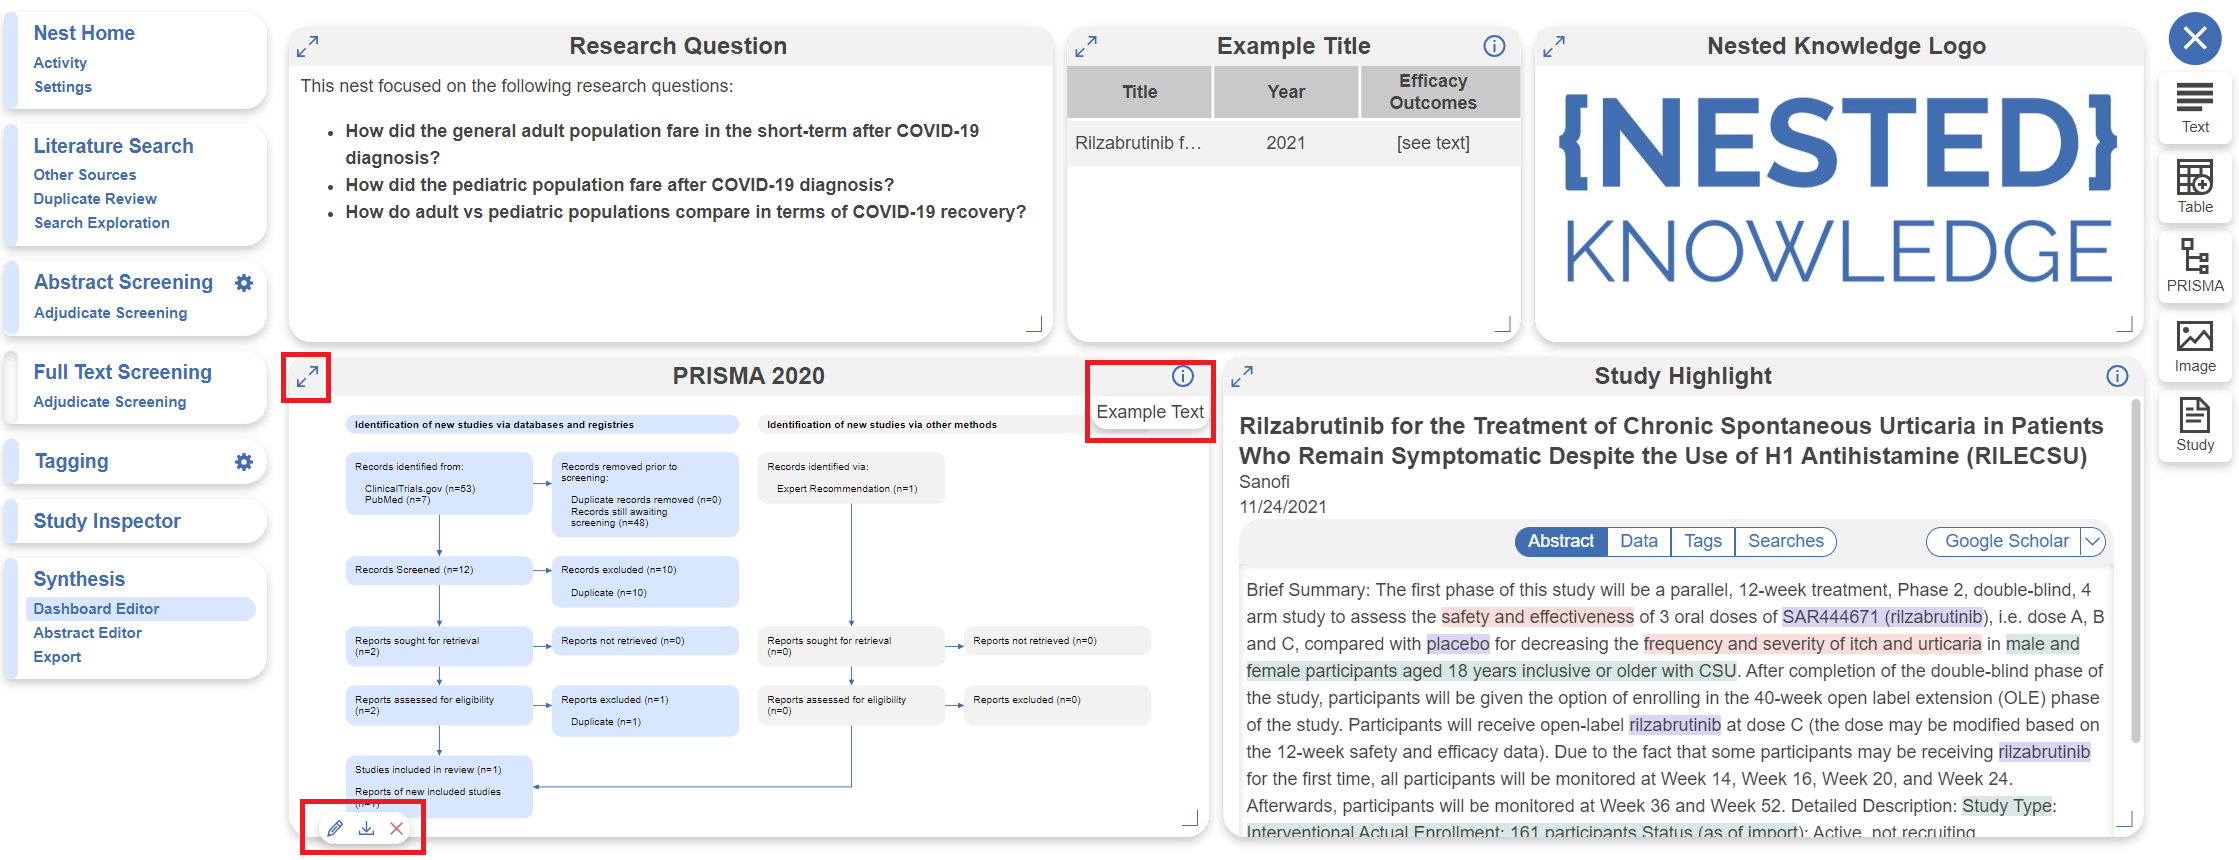
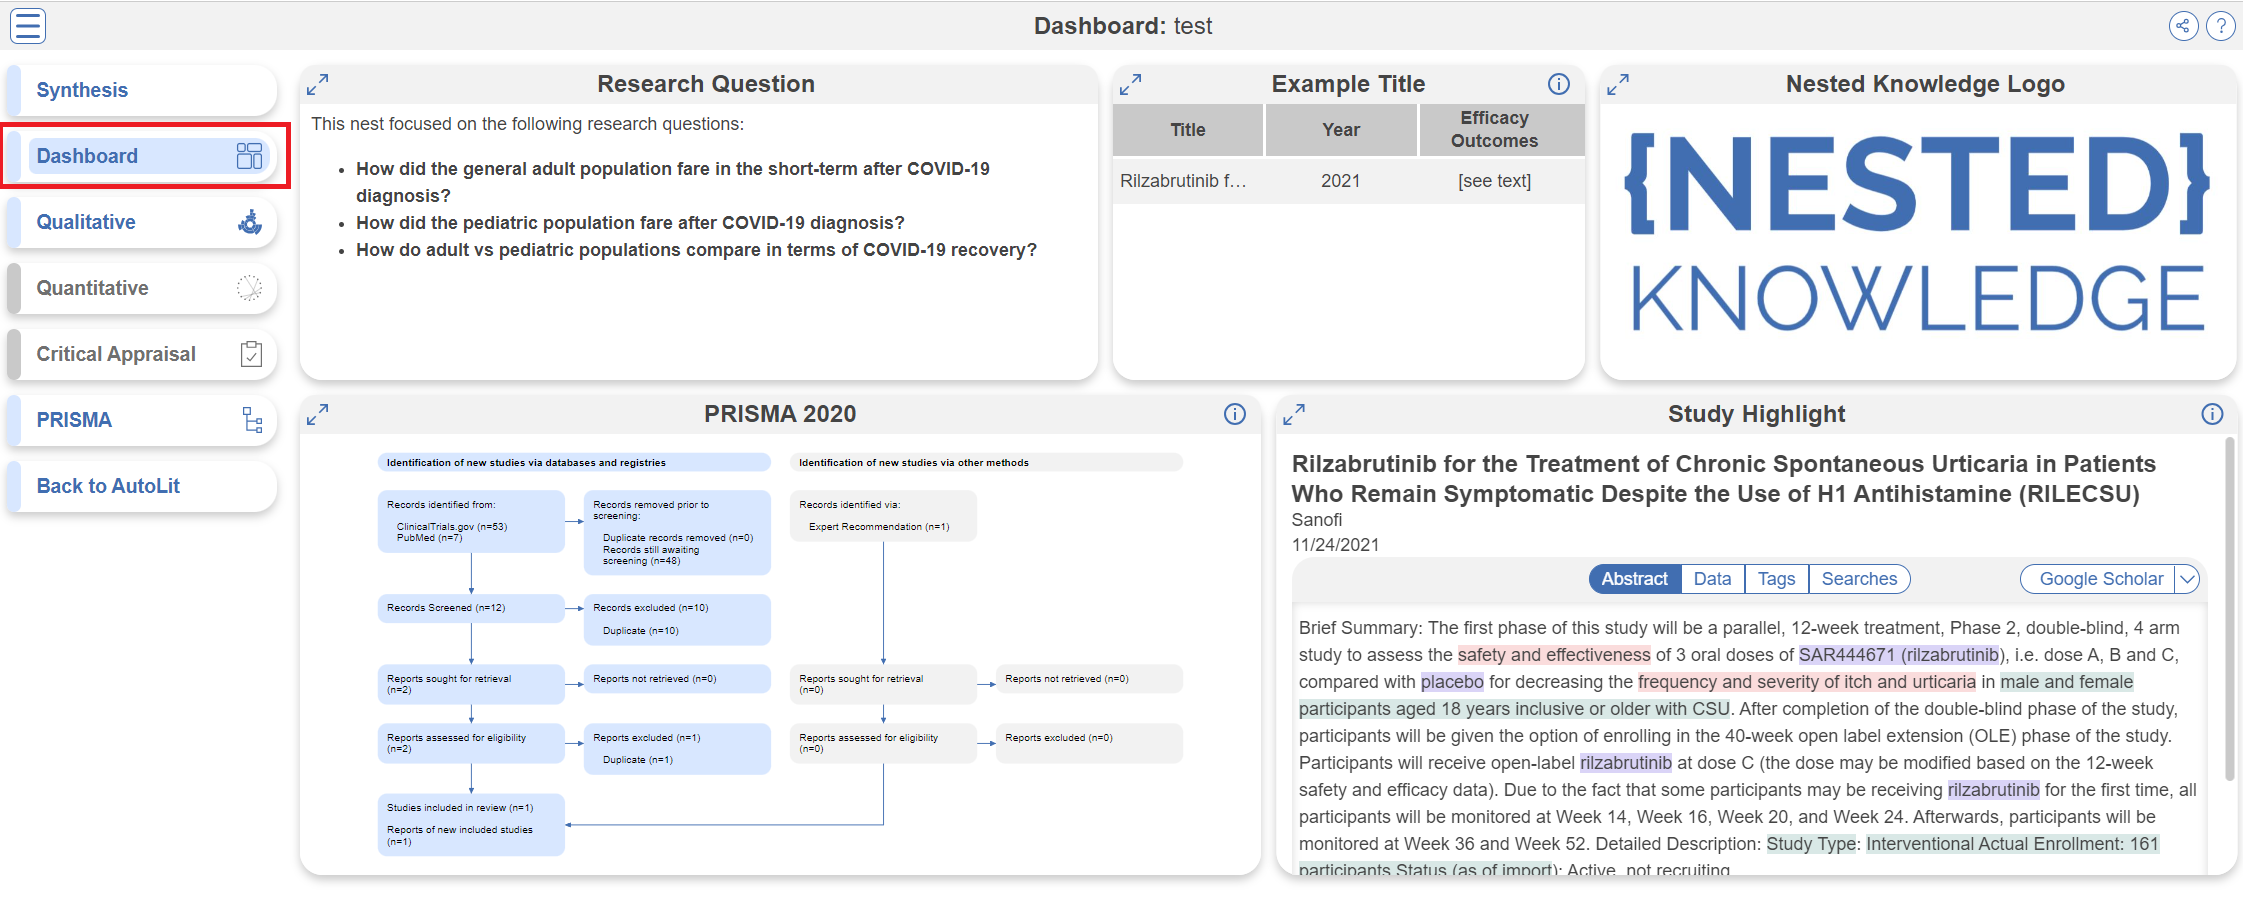
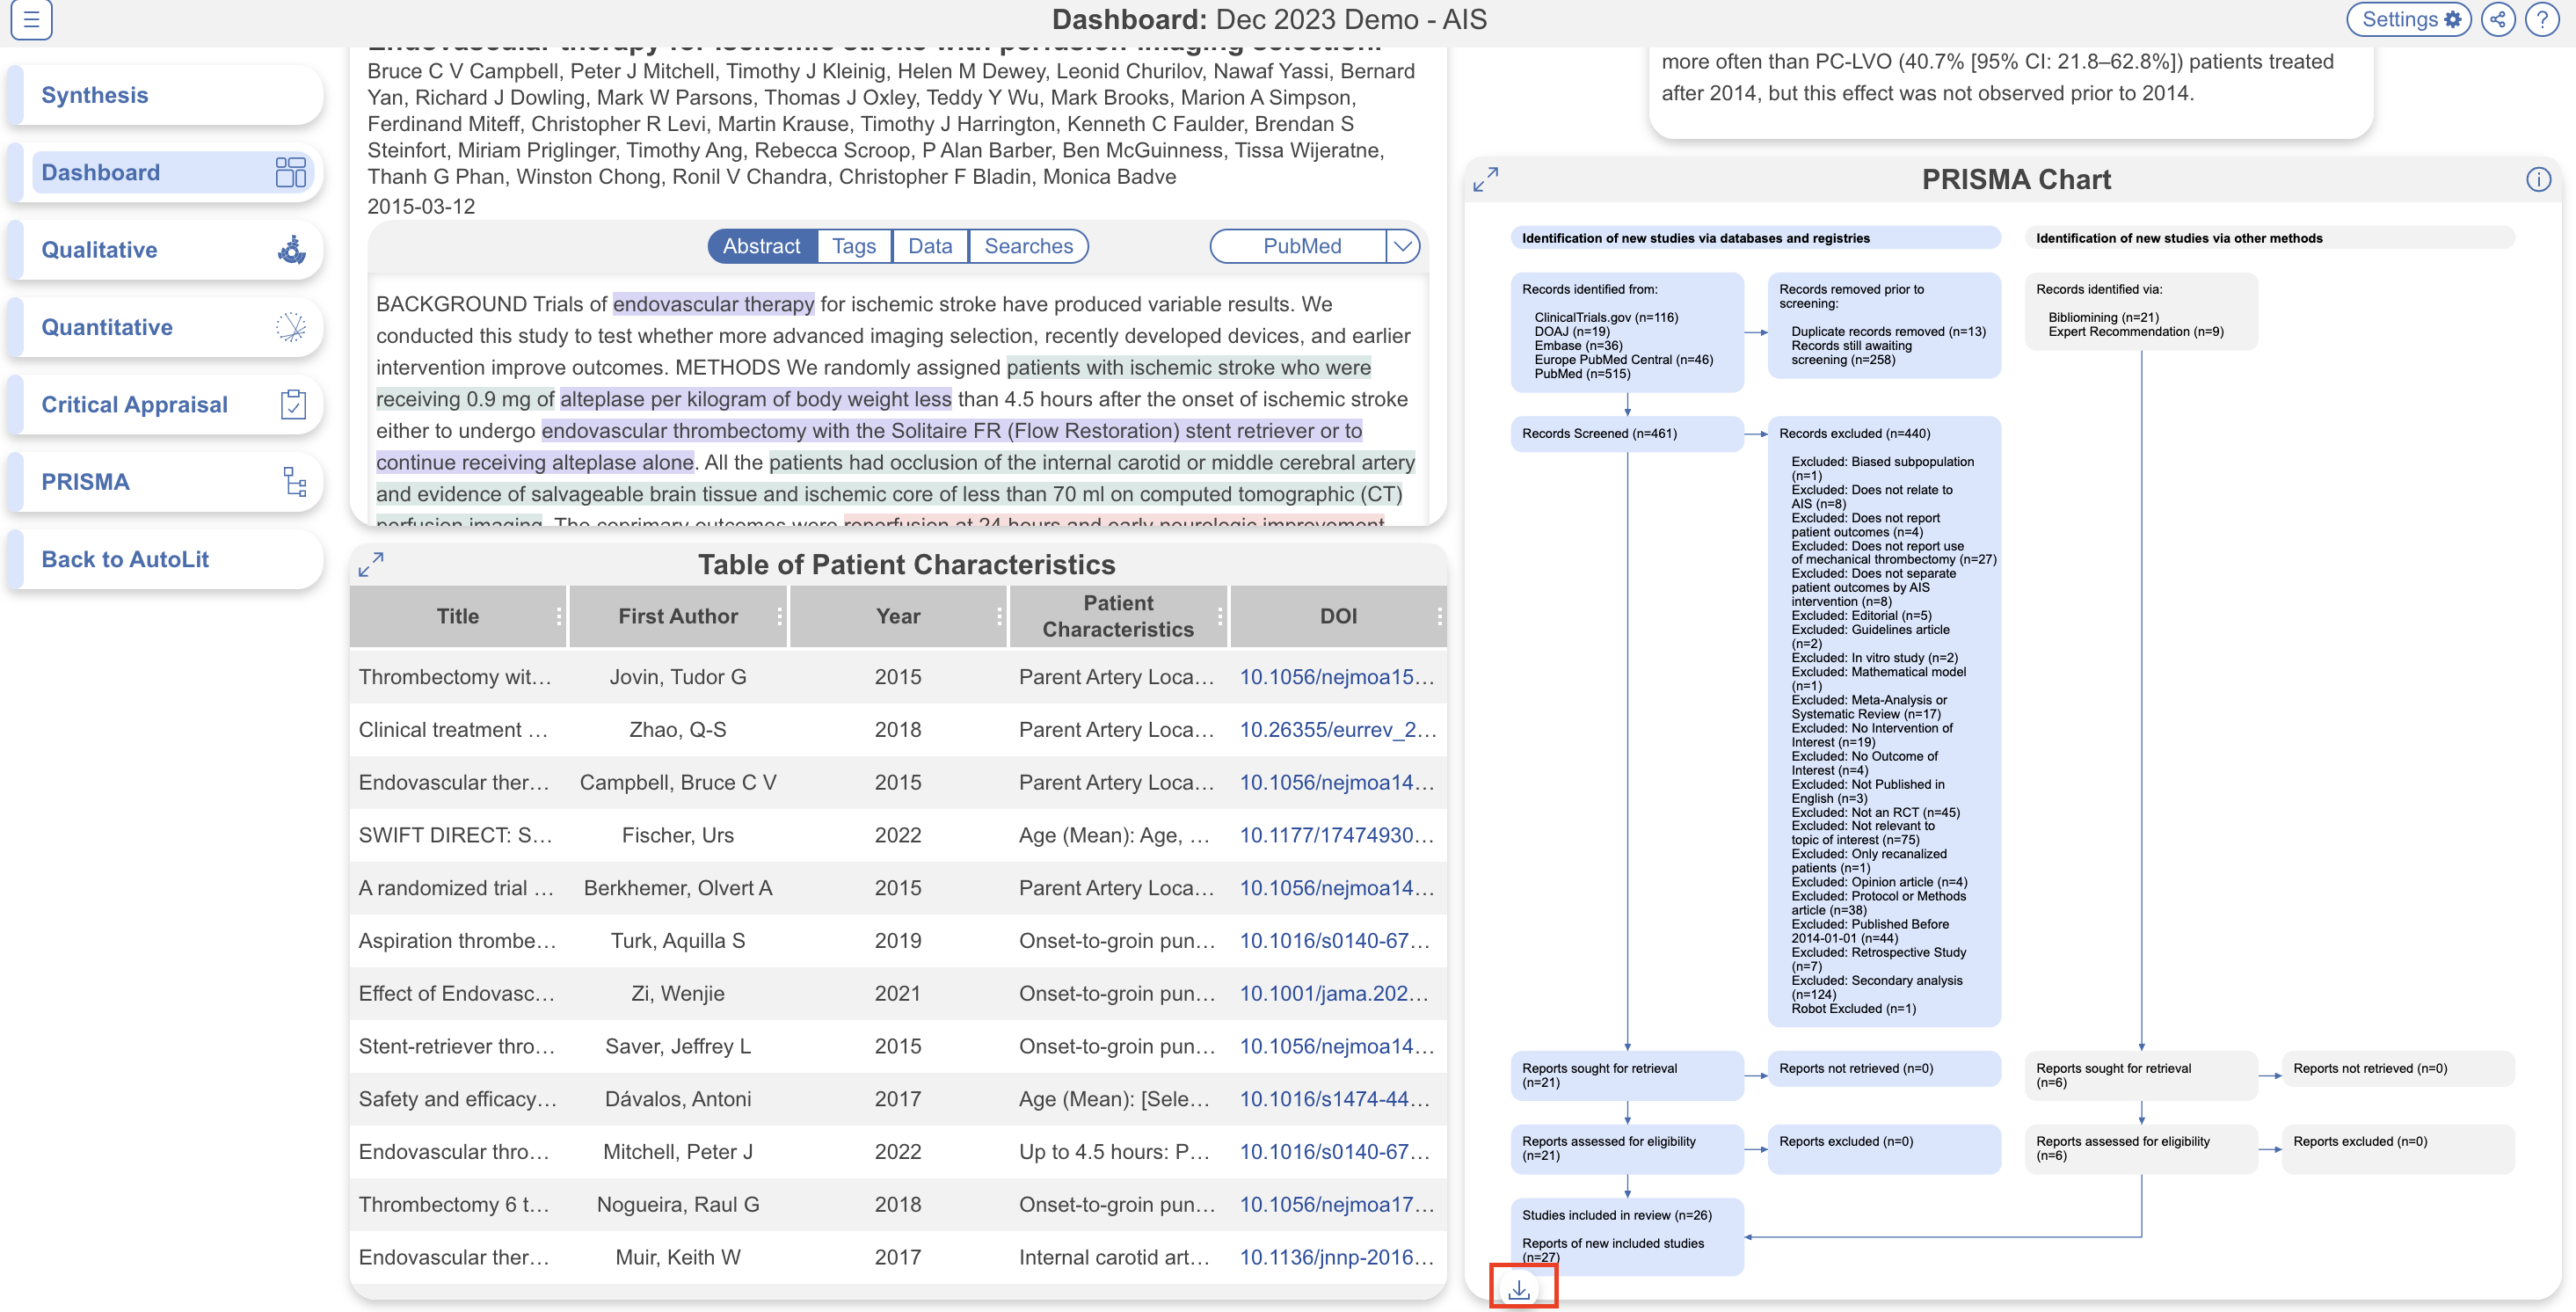
Nested Knowledge

Bringing Systematic Review to Life

User Tools

Site Tools


wiki:synthesis:dashboard

Dashboard

Dashboard is a feature that allows you to create customizable cards to present specific findings in Synthesis alongside our auto-generated outputs: Qualitative Synthesis, Quantitative Synthesis, Critical Appraisal, PRISMA 2009 & 2020 etc. These cards update as new data is inputted into the nest and are also easy to download for external use.

Toggle Dashboard on in Settings

In any nest, by default, Dashboard is not enabled. To enable the Dashboard feature, head to Settings and toggle on under Synthesis:

After toggling Dashboard on, “Dashboard Editor” will be displayed underneath the Synthesis menu item:

Note: When you toggle on Dashboard, Manuscript Editor is automatically toggled off, but don't worry– no work is lost when you switch between features.

Using Dashboard Editor

Navigate to Dashboard editor, and click the “+” icon in the top right to start adding cards by selecting your desired option.

Dashboard Card Types

The card options are listed for you to choose from; we currently offer the following card types:

  • Text Card = allows customized text input; the text editor offers the same tools as Abstract & Manuscript Editors

Once added, the text card will be displayed as a card on the Dashboard:

  • Table Card = allows addition of an updateable custom table; the table offers the same tools as Custom Tables in Export, but includes a title and description to be displayed alongside other cards in Dashboard. Learn more about how to use custom tables here.

Once added, the table card will be displayed alongside existing cards on the Dashboard:

  • PRISMA Card = allows addition of an updateable PRISMA diagram (either PRISMA 2009 or 2020); the diagram is the same as displayed in the Synthesis –> PRISMA tab, but includes a title and description to be displayed alongside other cards in Dashboard

Once added:

  • Image Card = allows addition of an image, including a title and description

Once added:

  • Study Card = allows you to spotlight a specific included study in the nest; search for a specific study using author name

Once added, the abstract is displayed with RoboPICO highlighting and this particular card is entirely interactive. You can explore the abstract, full text & supplements (only if toggled on in nest settings and nest is protected/private), related reports, tags, meta-analytical data (if MA Extraction was completed), search origin, and external links. Note: this is the same modal as displayed for associated studies in QLS, QNS and Critical Appraisal.

  • Tag Card = allows you to present data from tags as a miniature sunburst diagram, a choropleth/map, or a histogram.

Sunburst Diagram

A miniature sunburst diagram can be a great visual to display a snapshot of extracted data in a specific area, compared to Qualitative Synthesis, which displays all extracted data and is compatible with deeper dives into the included records. This card is designed to show an overview of number of tags applied.

Select Tag, give your card a Title and select Visual Type: Sunburst. Then select a Tag (ideally a parent tag to display tags beneath it in the visual), e.g. Study Design:

When added, the sunburst looks like this:

Choropleth / Map

A choropleth / map displays locations associated with the included records, and works best for tags such as Study Location that require text contents to contain a country. Select Tag, give your card a Title, and select Visual Type: Choropleth. Then select a Tag. If you previously ran and applied Core Smart Tags, simply select the Study Location tag:

When added, the choropleth looks like this:

Histogram

The histogram card allows you to display the distribution of a tag's numeric contents across records. A tag must have numeric contents only for the visual to be generated. For example, if you previously ran and applied Core Smart Tags, you can select the Study Size tag:

When added, the histogram looks like this:

Editing Dashboard Display

After mixing and matching your desired cards, you can adjust and move them as they are displayed in the editor and this will alter how they are displayed in Synthesis:

  1. Drag and Drop cards by click anywhere within the card and moving their position
  2. Expand or reduce the size of each card using the arrow in the bottom right corner, other cards will move accordingly

Other Tools

  1. Expand each card into an easy-to-view modal by clicking the arrows in the top left
  2. View the card description by hovering over the “i” icon in the top right
  3. Edit, download, or delete each card by using the pencil, download and “X” icons, respectively
    1. Text card exports as a word doc
    2. Table card exports as a .csv file
    3. Image and PRISMA cards export as a .jpg file

Note: the Download function is currently only available for Text, Table, Image, and PRISMA card types.

Dashboard in Synthesis

To access Dashboard, head to Synthesis and click the “Dashboard” menu item. The appearance of Synthesis Dashboard will be exactly as configured in Dashboard Editor. Here you can expand each card (including resizability of columns within the table card), view associated descriptions, and download available cards.

Note: any links in custom tables will link out.

Filtering Synthesis

While Synthesis Filters are unavailable for Dashboard & Manuscript, they can be applied to all other parts of Synthesis. Learn more about Synthesis Filters.

Downloading Dashboard Cards

Any card that is downloadable will have the following icon when hovered over:

Sharing Dashboard

Like other parts of Synthesis, and provided Synthesis is configured for public access (see Settings), Dashboard is available to share as a link or via QR code by click on the share icon in the top right corner, next to the ? wiki icon.

wiki/synthesis/dashboard.txt · Last modified: 2024/09/23 15:15 by jthurnham