Table of Contents
Critical Appraisal Visuals
Nested Knowledge automatically generates your Domain Distribution and Traffic Light diagrams if you complete Critical Appraisal through our AutoLit Critical Appraisal module.
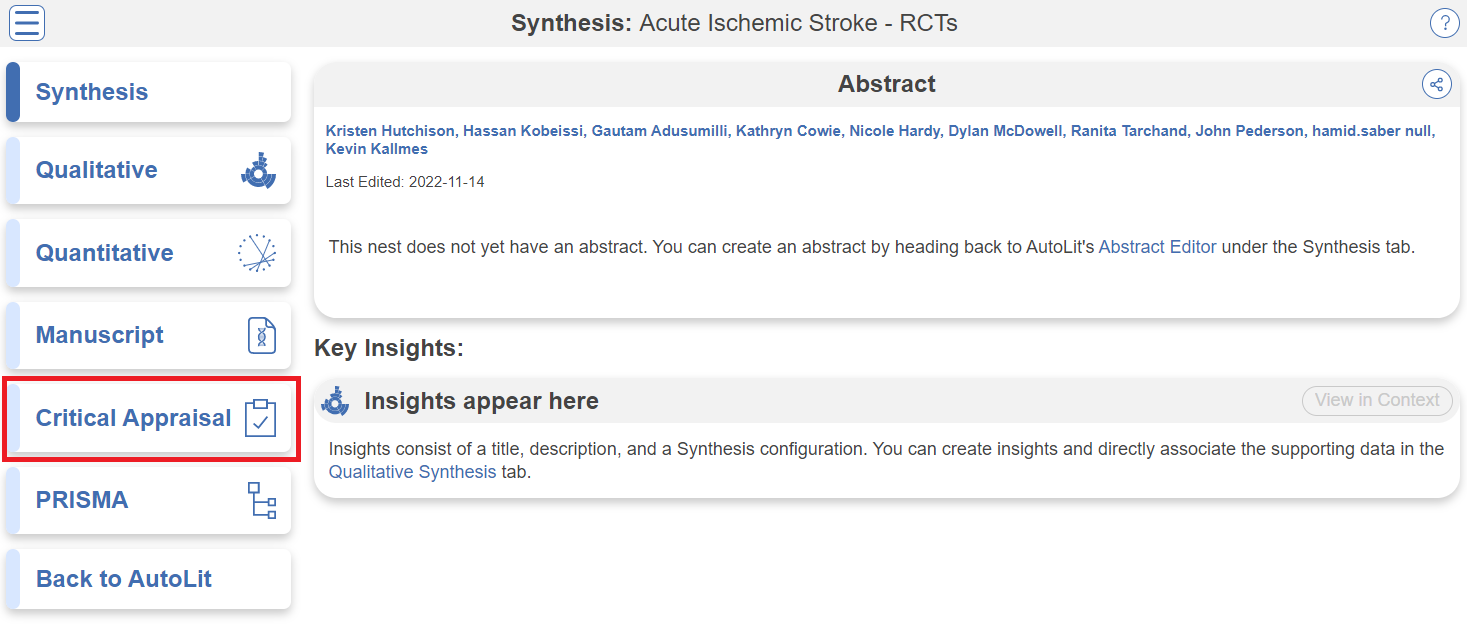
Navigating to Critical Appraisal Visuals
Critical Appraisal visuals are found on the Synthesis page, at the bottom of the Contributors column:
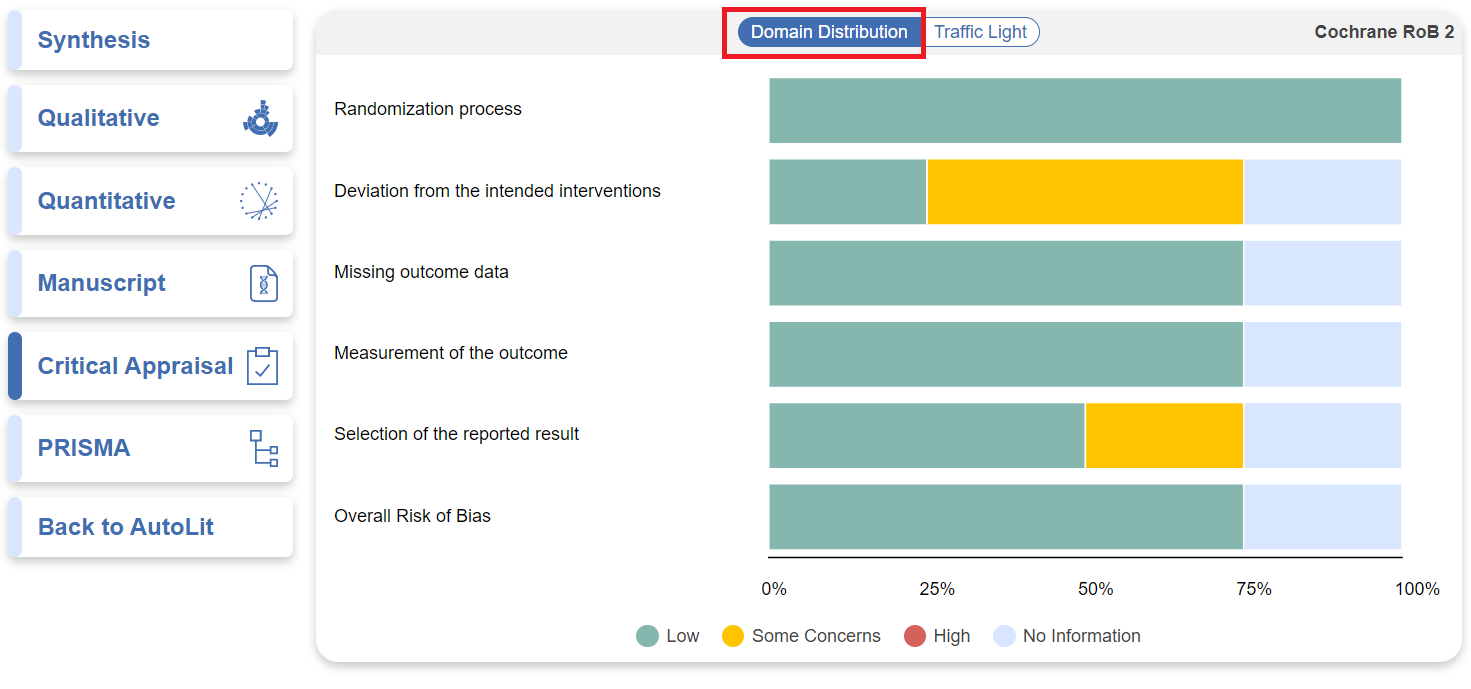
Domain Distribution Diagram
Once you have navigated to the visuals, you can see the Domain Distribution plots. The categories presented will depend on the Critical Appraisal survey you completed; in the visual below, see the Cochrane RoB2 tool's outputs for Internal Validity and Overall Assessment of risk. These represent global assessments across a nest, rather than study-level outputs.
Traffic Light Diagram
Traffic Light diagrams represent study-by-study assessments, where each column is a study-level assessment of the category in question (here, the Internal Validity and Overall Assessment from Cochrane RoB2 tool's survey.
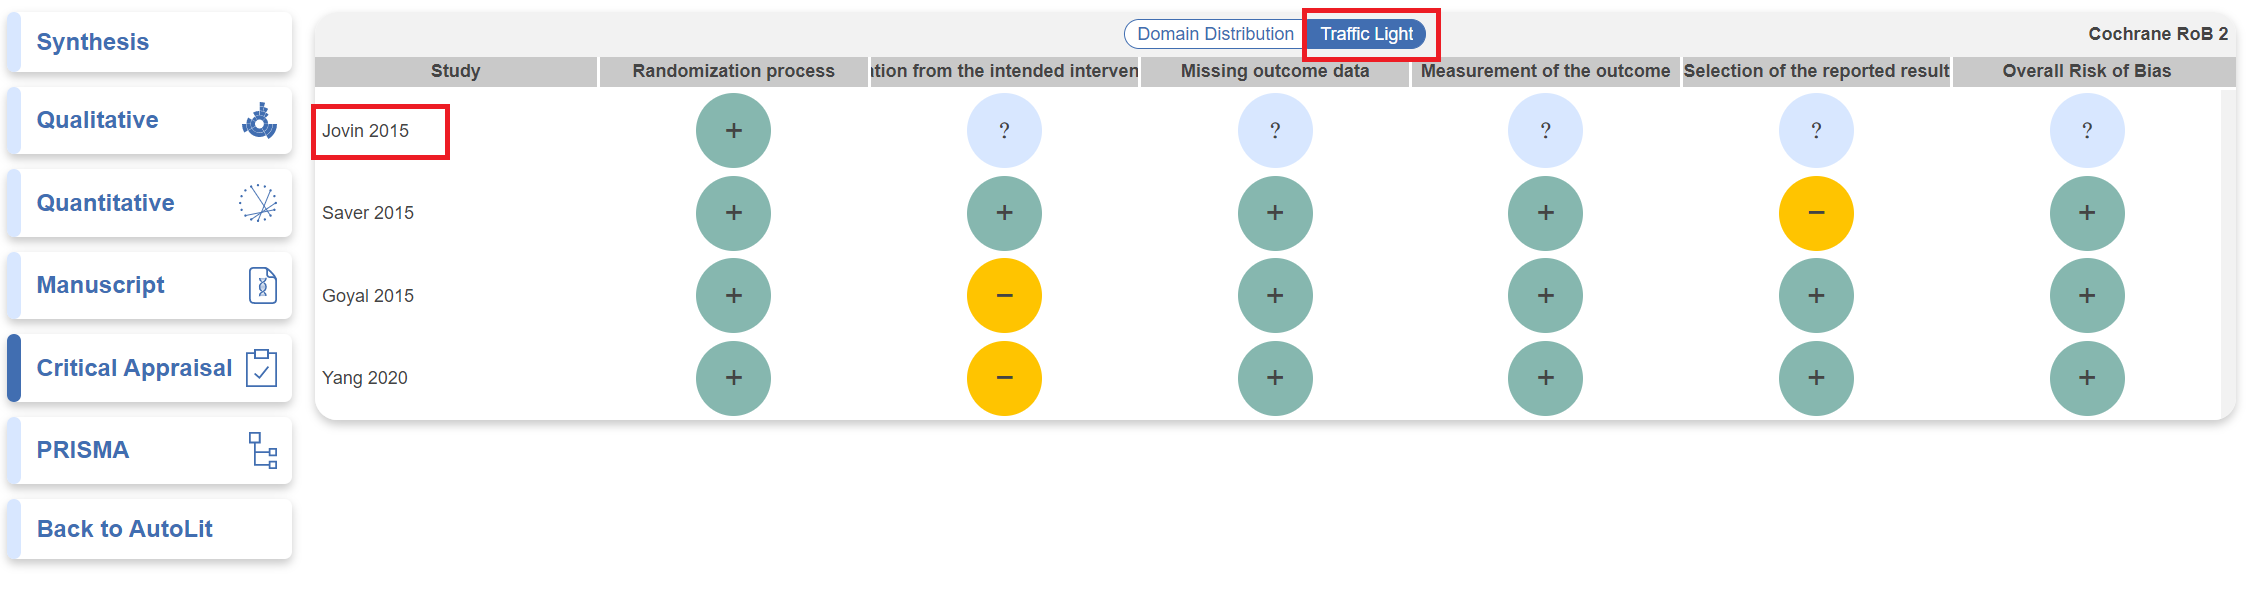
The study Author/Year (red box) is clickable, opening the Study Modal showing the abstract, data, tags, and search history for the study in question.
Filtering Synthesis
You can also apply broader filters to view specific sets of studies via the Settings button in the top right. Learn more about Synthesis Filters.
Share or Download
Similar to QLS and QNS, you can share your Critical Appraisal page by clicking on the share icon in the top right. You have the choice of sharing via a link or downloading a QR code.