Table of Contents
Qualitative Synthesis
Qualitative Synthesis presents the results of your Tagging in an interactive visual. You can use it to drill down on the qualitative content of underlying studies, and it should be used in combination with the screening outputs on the PRISMA diagram and the meta-analytical results displayed in Quantitative Synthesis.
1. Navigate to Synthesis
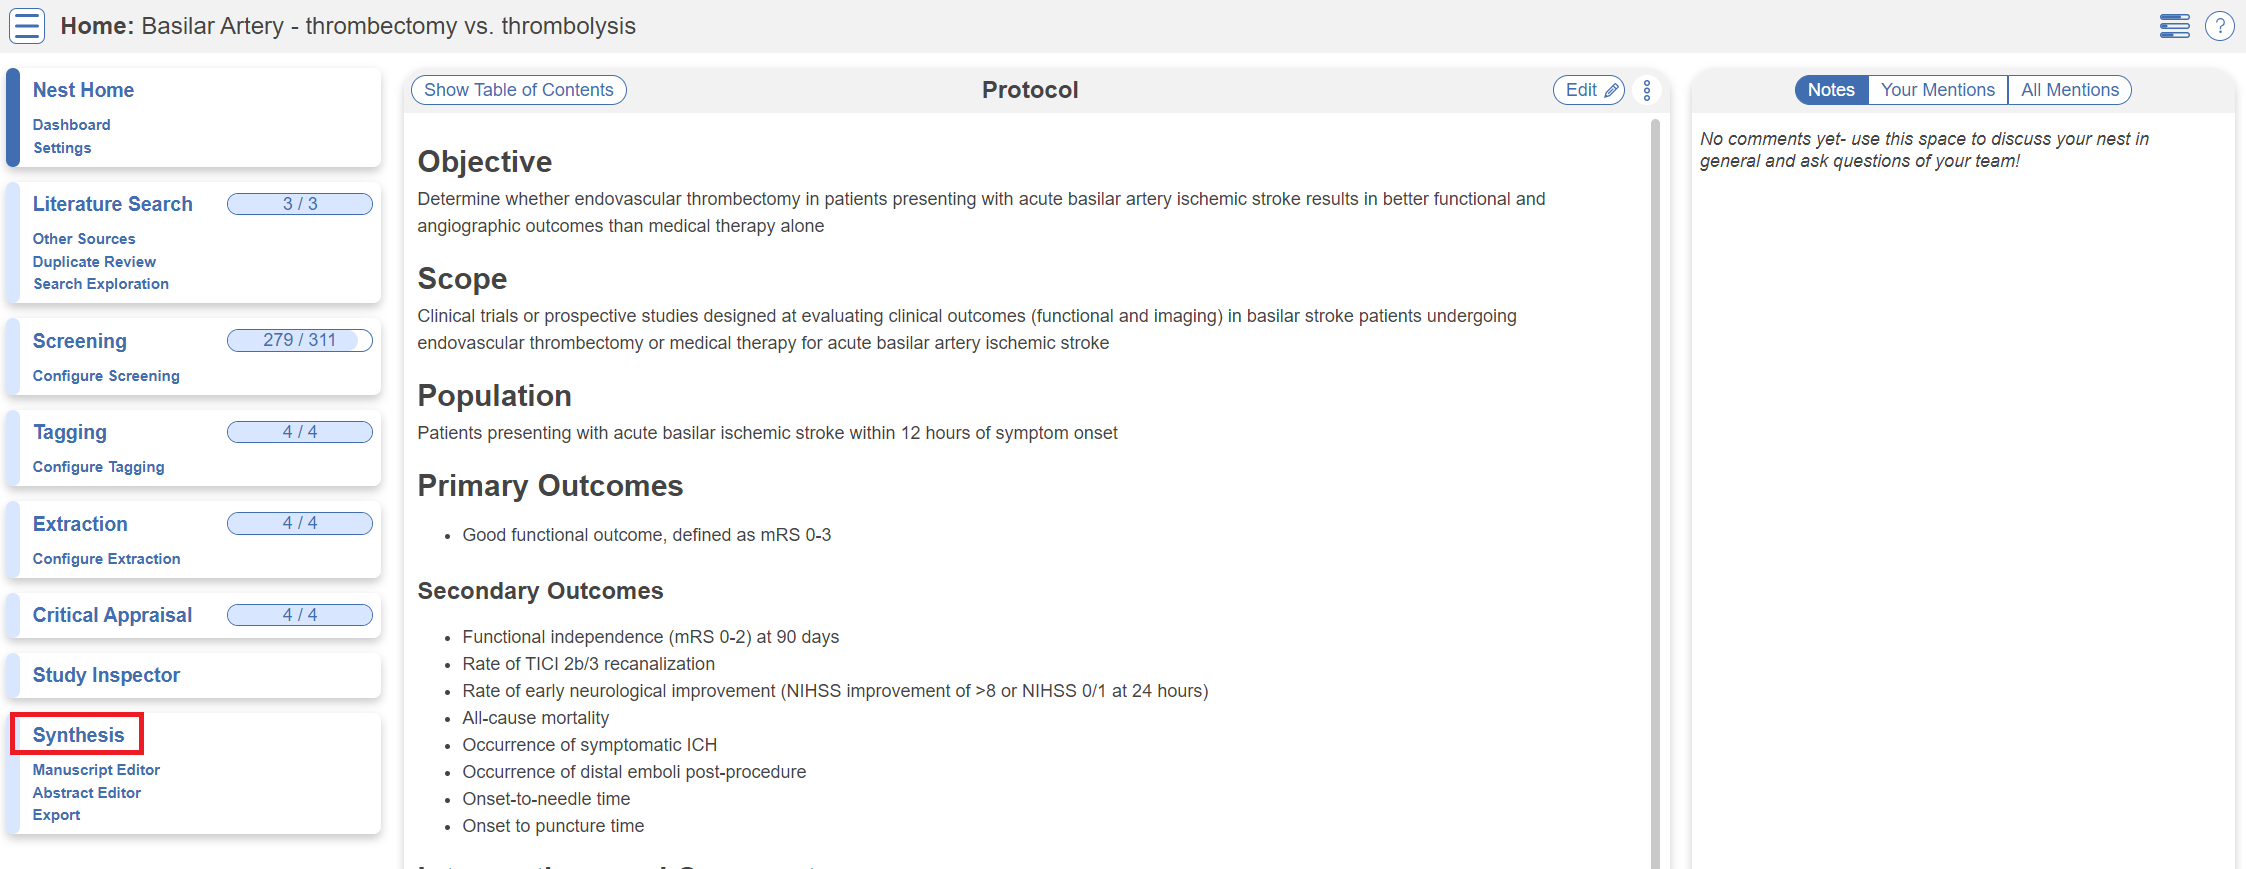
From the Nest menu, click on “Synthesis” in the left hand menu.
2. Navigate to Qualitative Synthesis
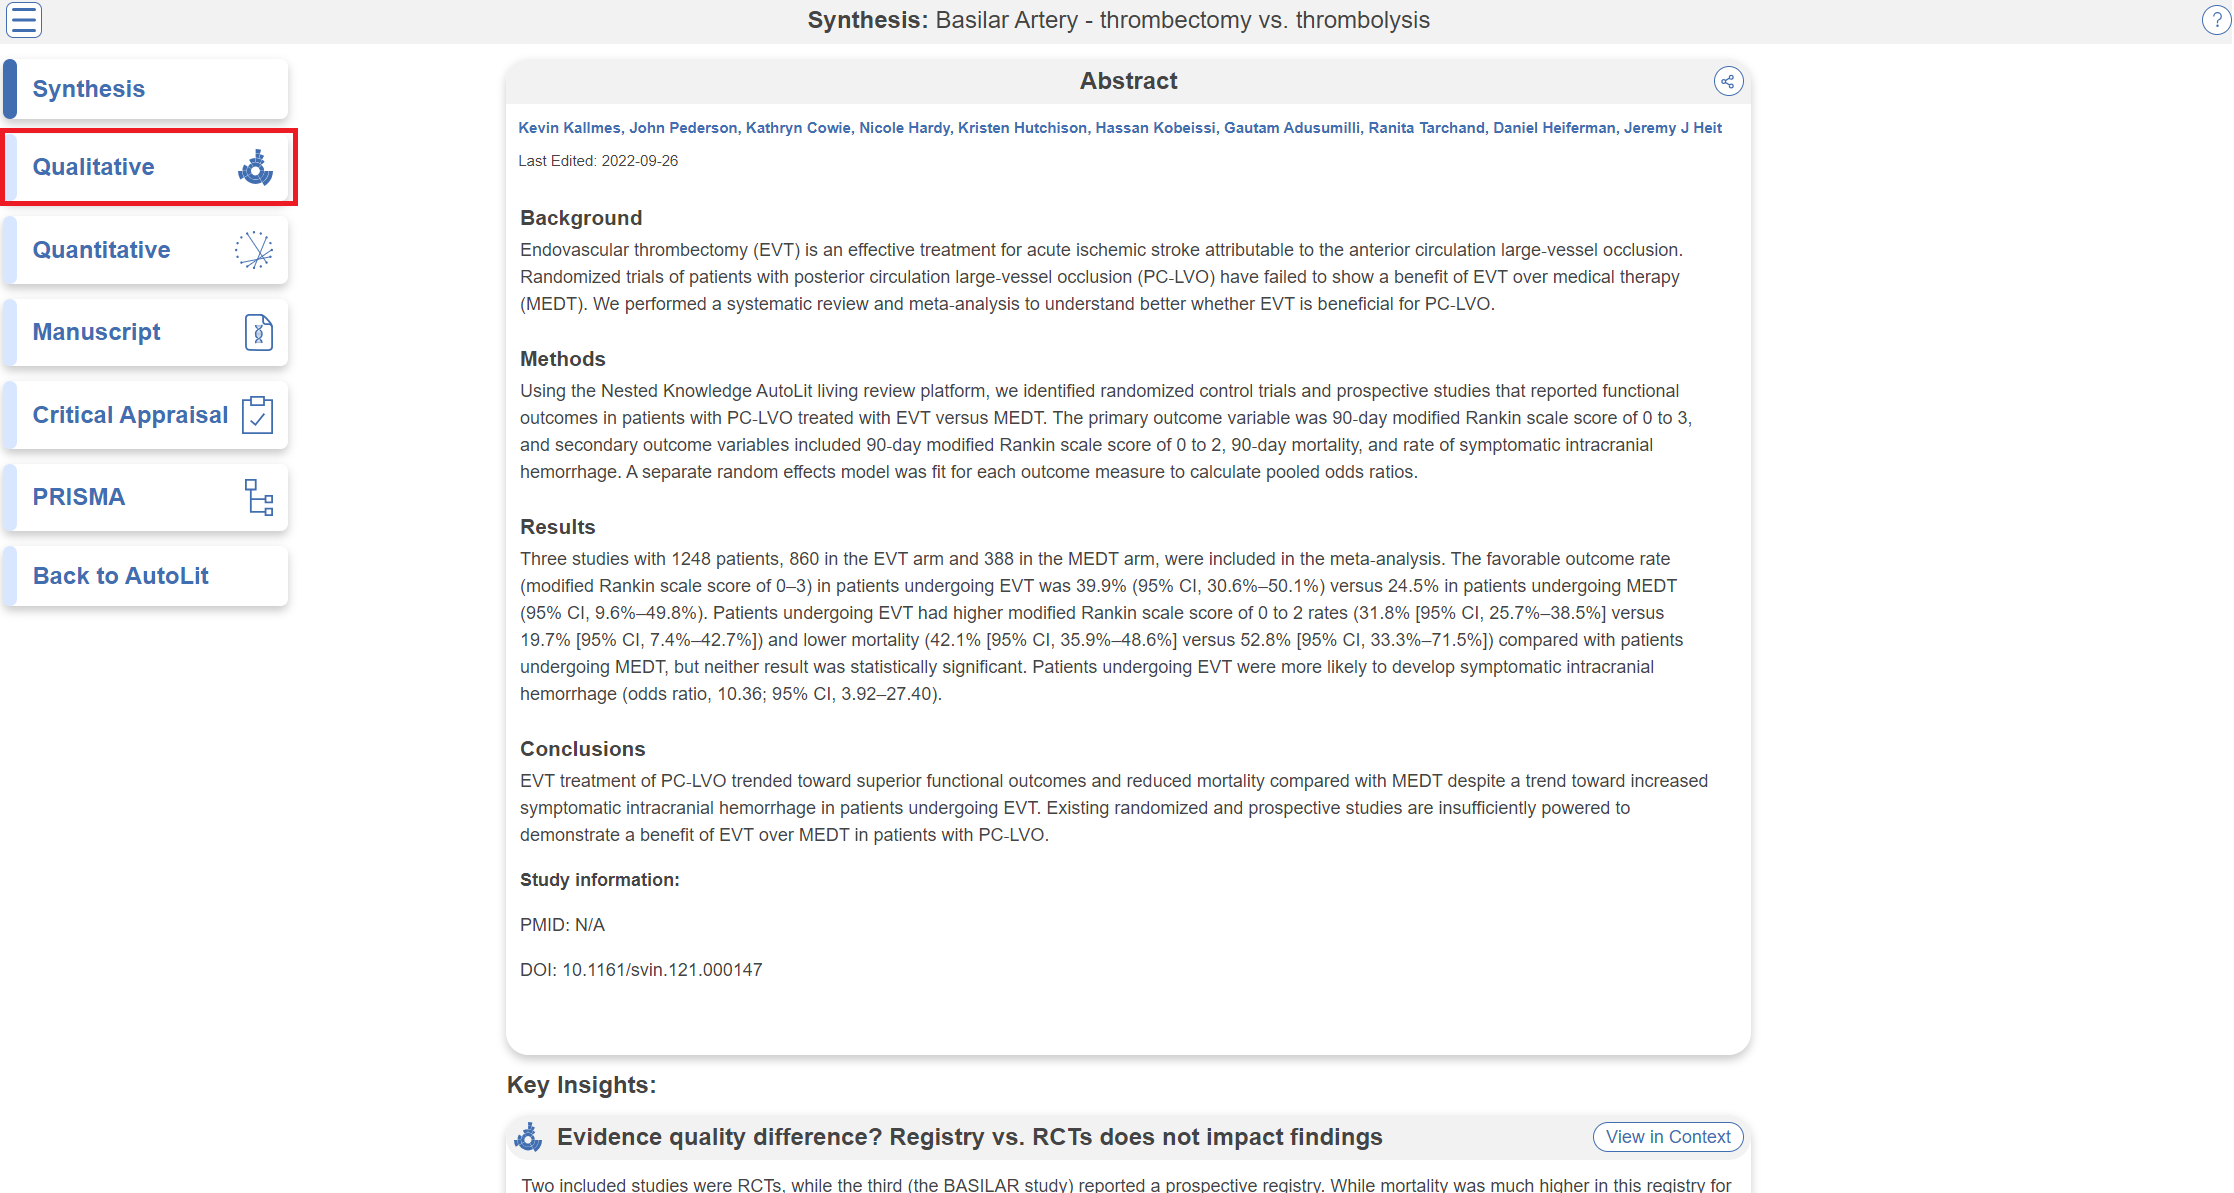
Click on the “Qualitative Synthesis” box.
3. Explore Sunburst View
Sunburst is an interactive feature that allows you to explore all tags within a Nest. Explore using the following functions:
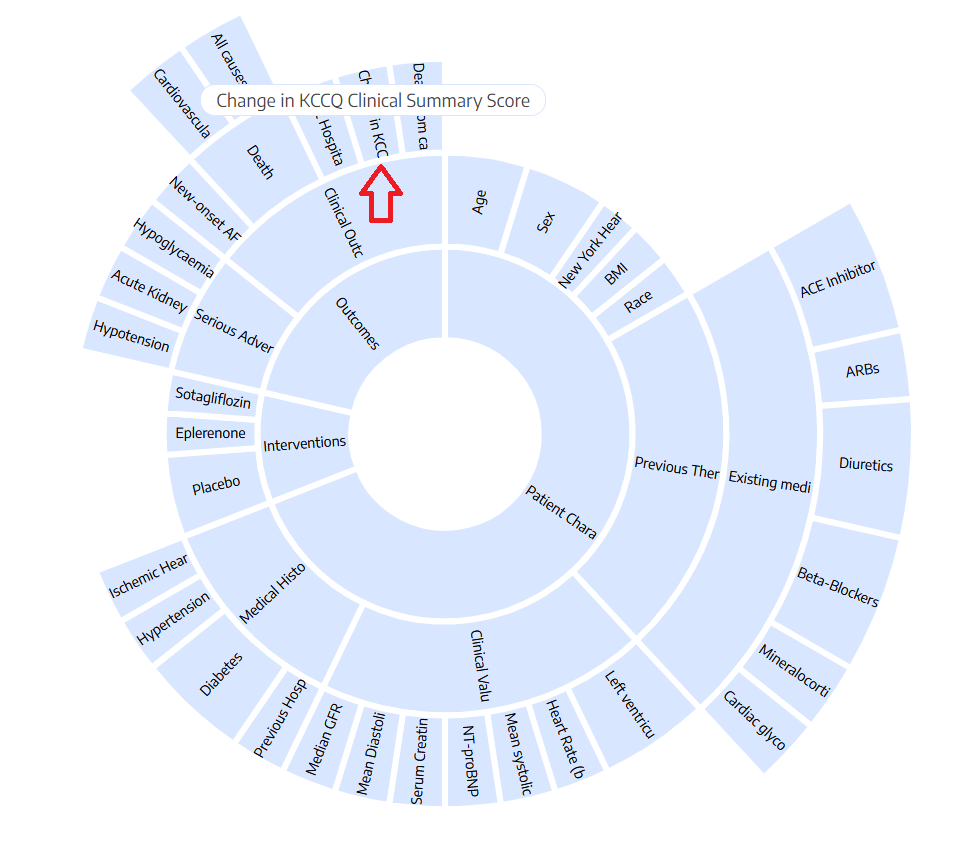
Hovering over each segment shows you the full tag name.
Filter the Sunburst
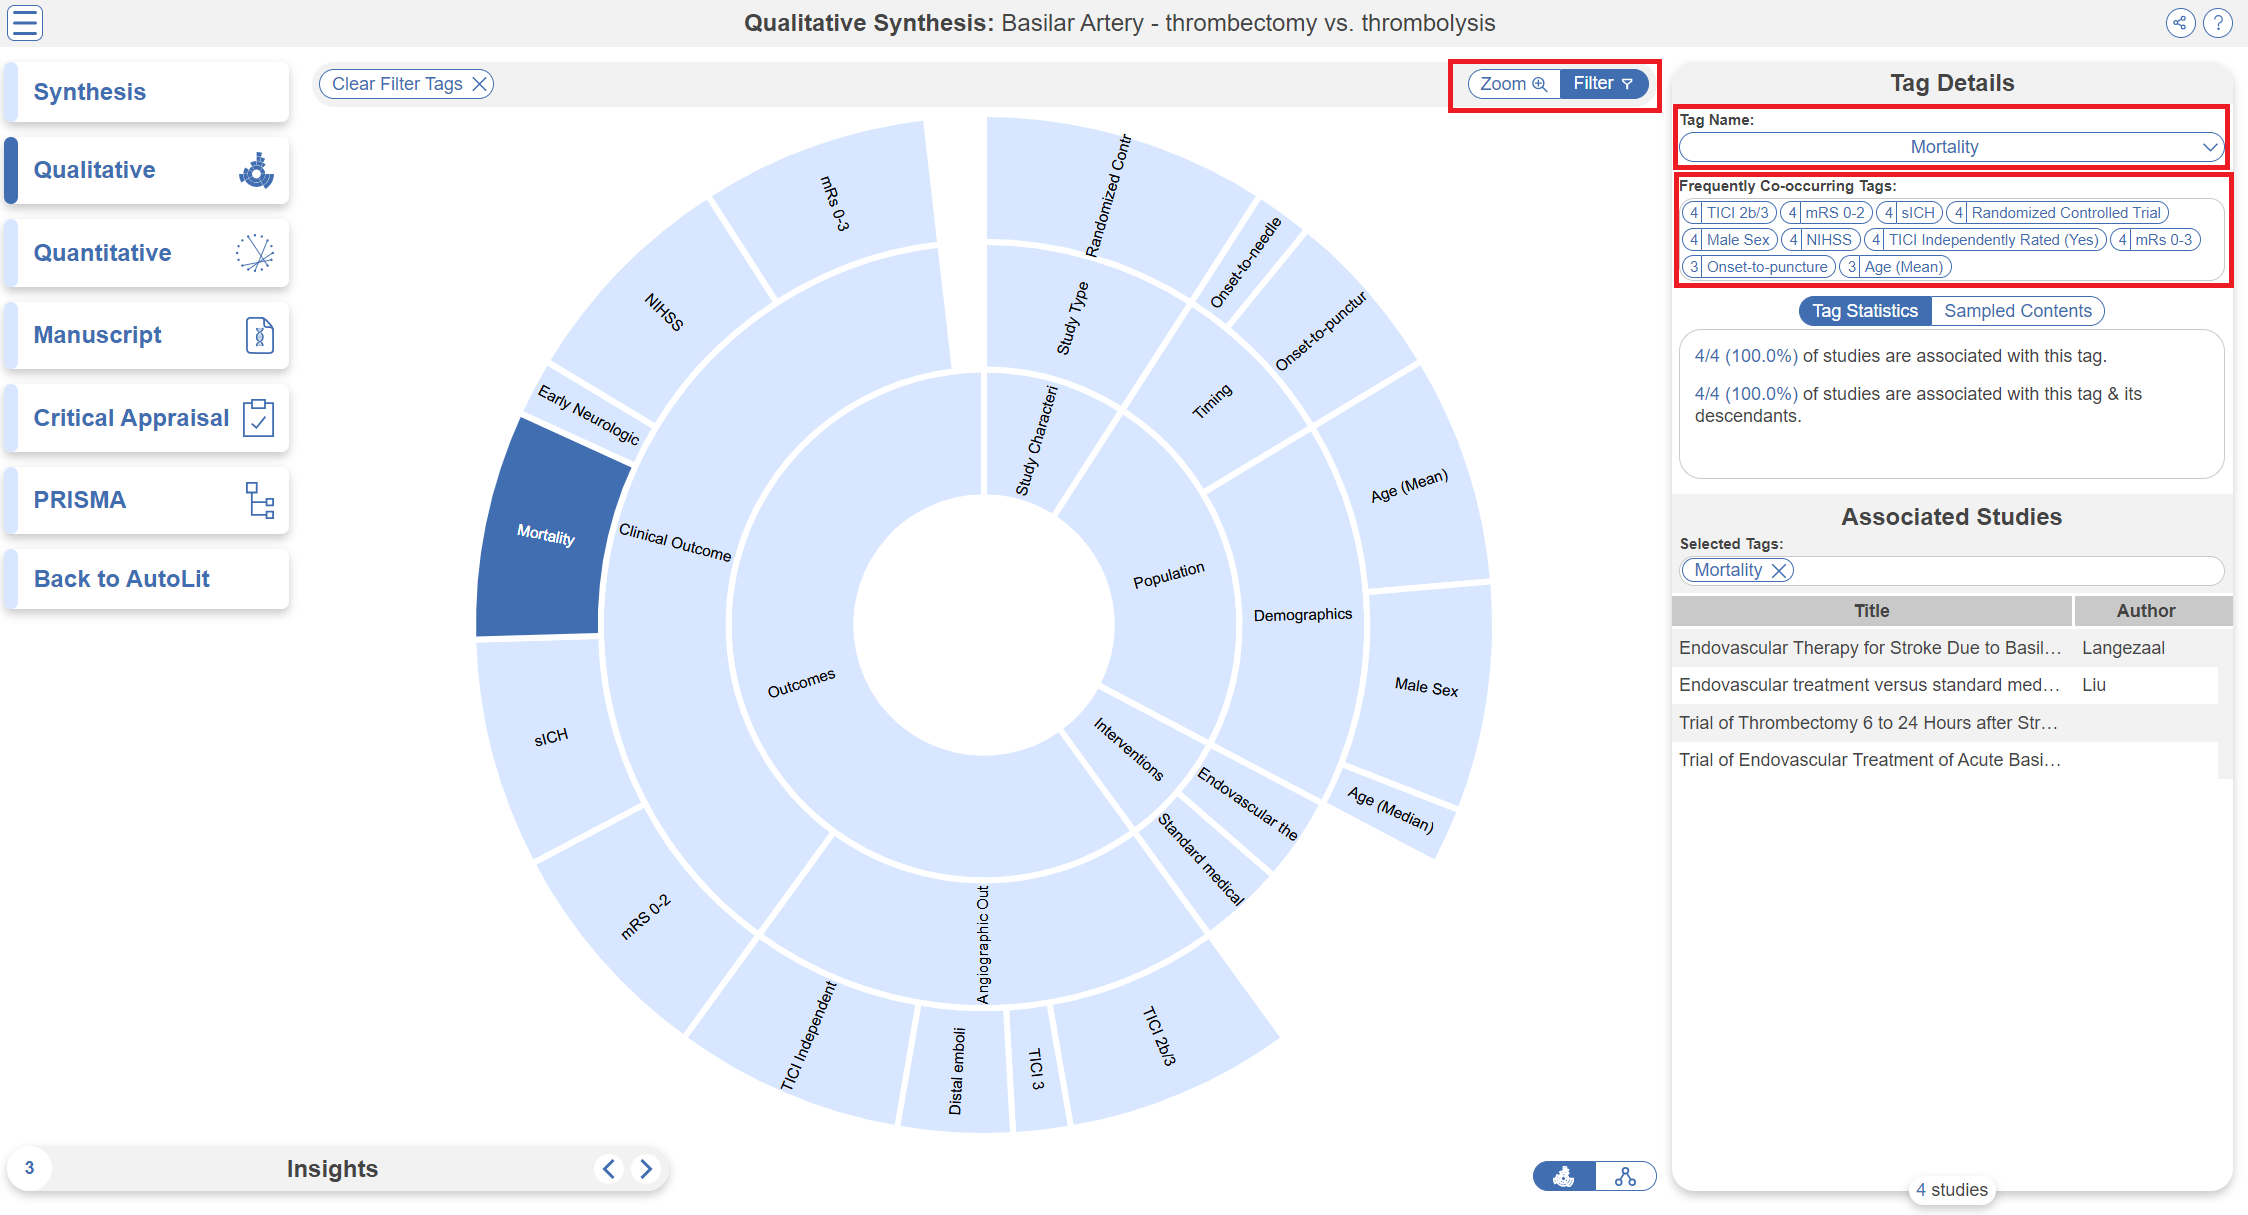
- Click on Sunburst segments: To filter the list of Associated Studies on the right, toggle on the “Filter” button, and click any segment of the Sunburst diagram. If you select multiple segments, the filters will be stacked– that is, only records with BOTH tags applied will be presented in the study list.
- Clearing selection: You can clear all tags selected by clicking “Clear Filter Tags” in the upper left.
- Frequently Co-occurring Tags: Once you select segment(s), a list of the most commonly-occurring tags will automatically pop up under Tag Search.
- View Tag Statistics: Beneath Frequently Co-occurring Tags, the Tag Statistics box shows the number of studies associated with the most recently selected tag, as well as that tag & its descendants.
- View Sample Contents: Toggle from Tag Statistics to Sample Contents to see the tag text excerpts associated with studies based on your most recently selected tag.
- Use Tag Search: Alternatively, if you cannot find the tag you want to filter by, use the Tag Search (upper right) to select the segment of interest.
- Note: Tag Search is located in the upper right, under “Tag Name”.
Filtering Synthesis
Alongside filtering the sunburst, you can also apply broader filters to view specific sets of studies via the Settings button in the top right. Learn more about Synthesis Filters.
Zoom on the Sunburst
- Zoom: Qualitative Synthesis Zoom functions by 'drilling down' on tags of interest. To switch from “Filtering” to “Zooming” on segments of the sunburst diagram, toggle to “Zoom” in the upper right of the page:
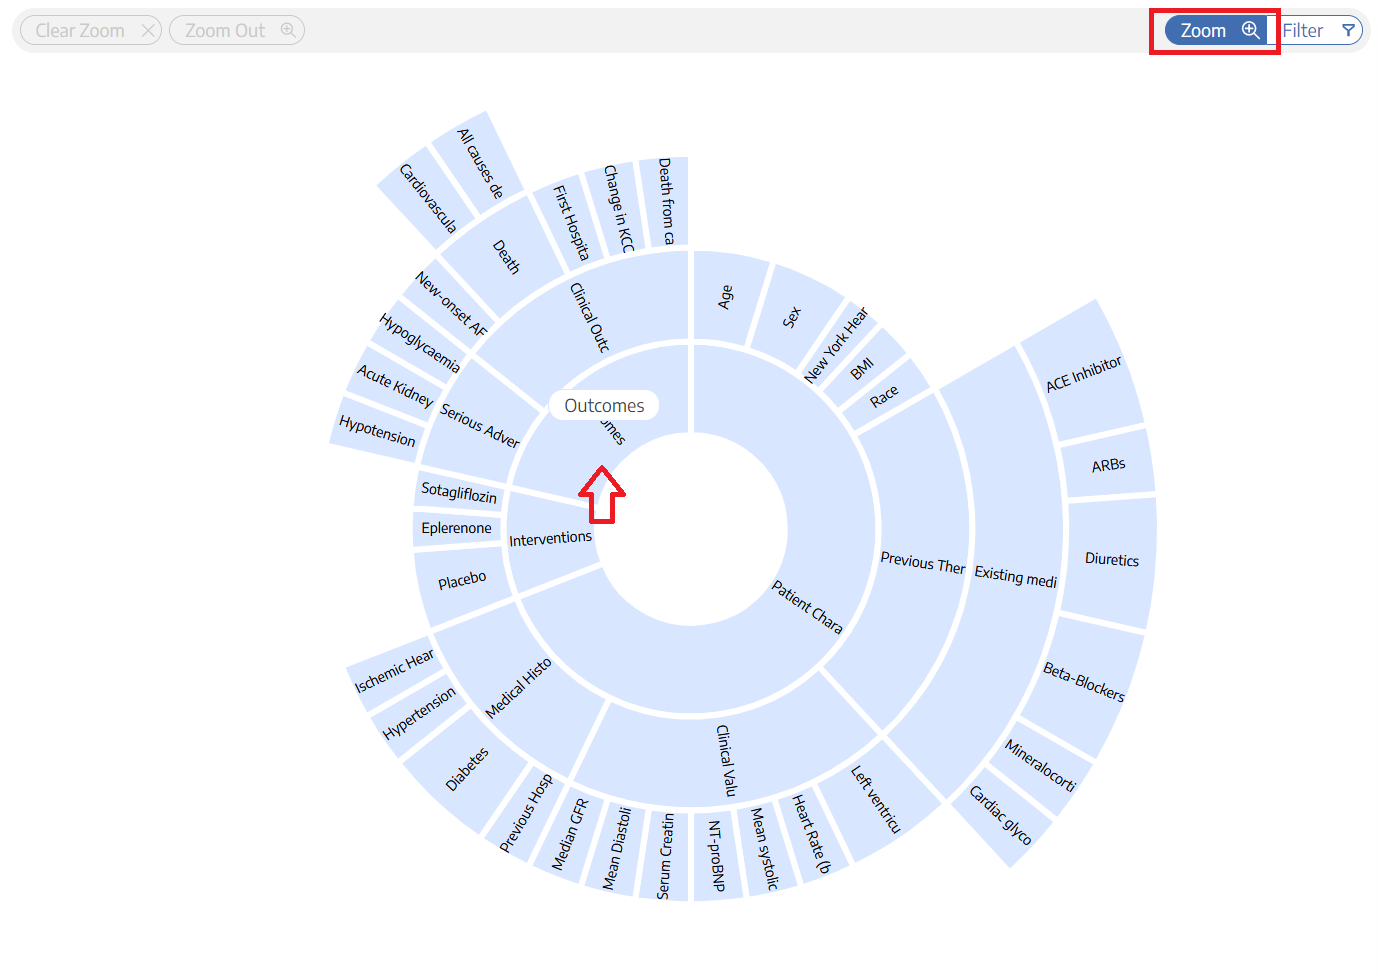
Then, select the tag that you would like to be the new 'inner ring' of your sunburst. In the example above, selecting “Outcomes” makes it the new inner ring, with all sub-tags displayed in the next ring:
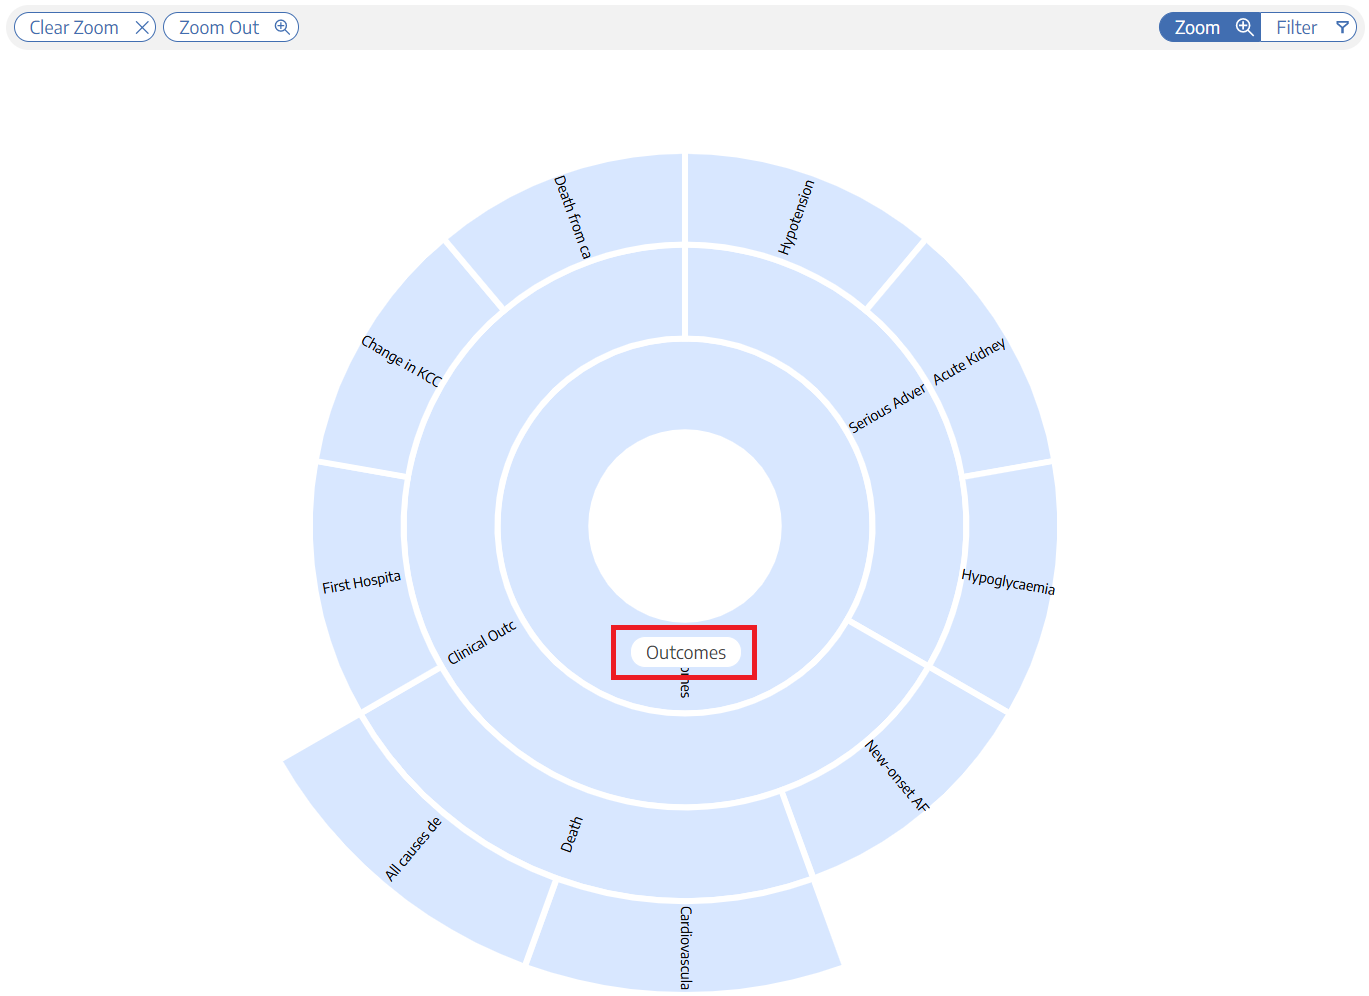
This Zooming action can be done iteratively– that is, selecting any tag below “Outcomes” in the example above would make that new tag the inner ring.
When you are finished Zooming in, you can:
- Filter: To switch back to Filtering the Zoomed-in sunburst, toggle to “Filter” in the upper right; or
- Clear Zoom: To Zoom out to the full sunburst, click “Clear Zoom” in the upper left.
Reorder or Hide Segments on Sunburst
Since the order of segments shown on the sunburst reflects the order of tags in the tagging hierarchy, you may wish to reorder these tags. See instructions on how to Reorder Tags.
If you wish to hide tags in Synthesis, see instructions here. Tags will only be hidden in Synthesis and will still be present in AutoLit.
4. Explore Dendrogram View
You can also view and share our interactive output in the form of a dendrogram, which closely mirrors the tagging hierarchy in AutoLit. You can toggle between the two forms using the icons in the bottom right corner:
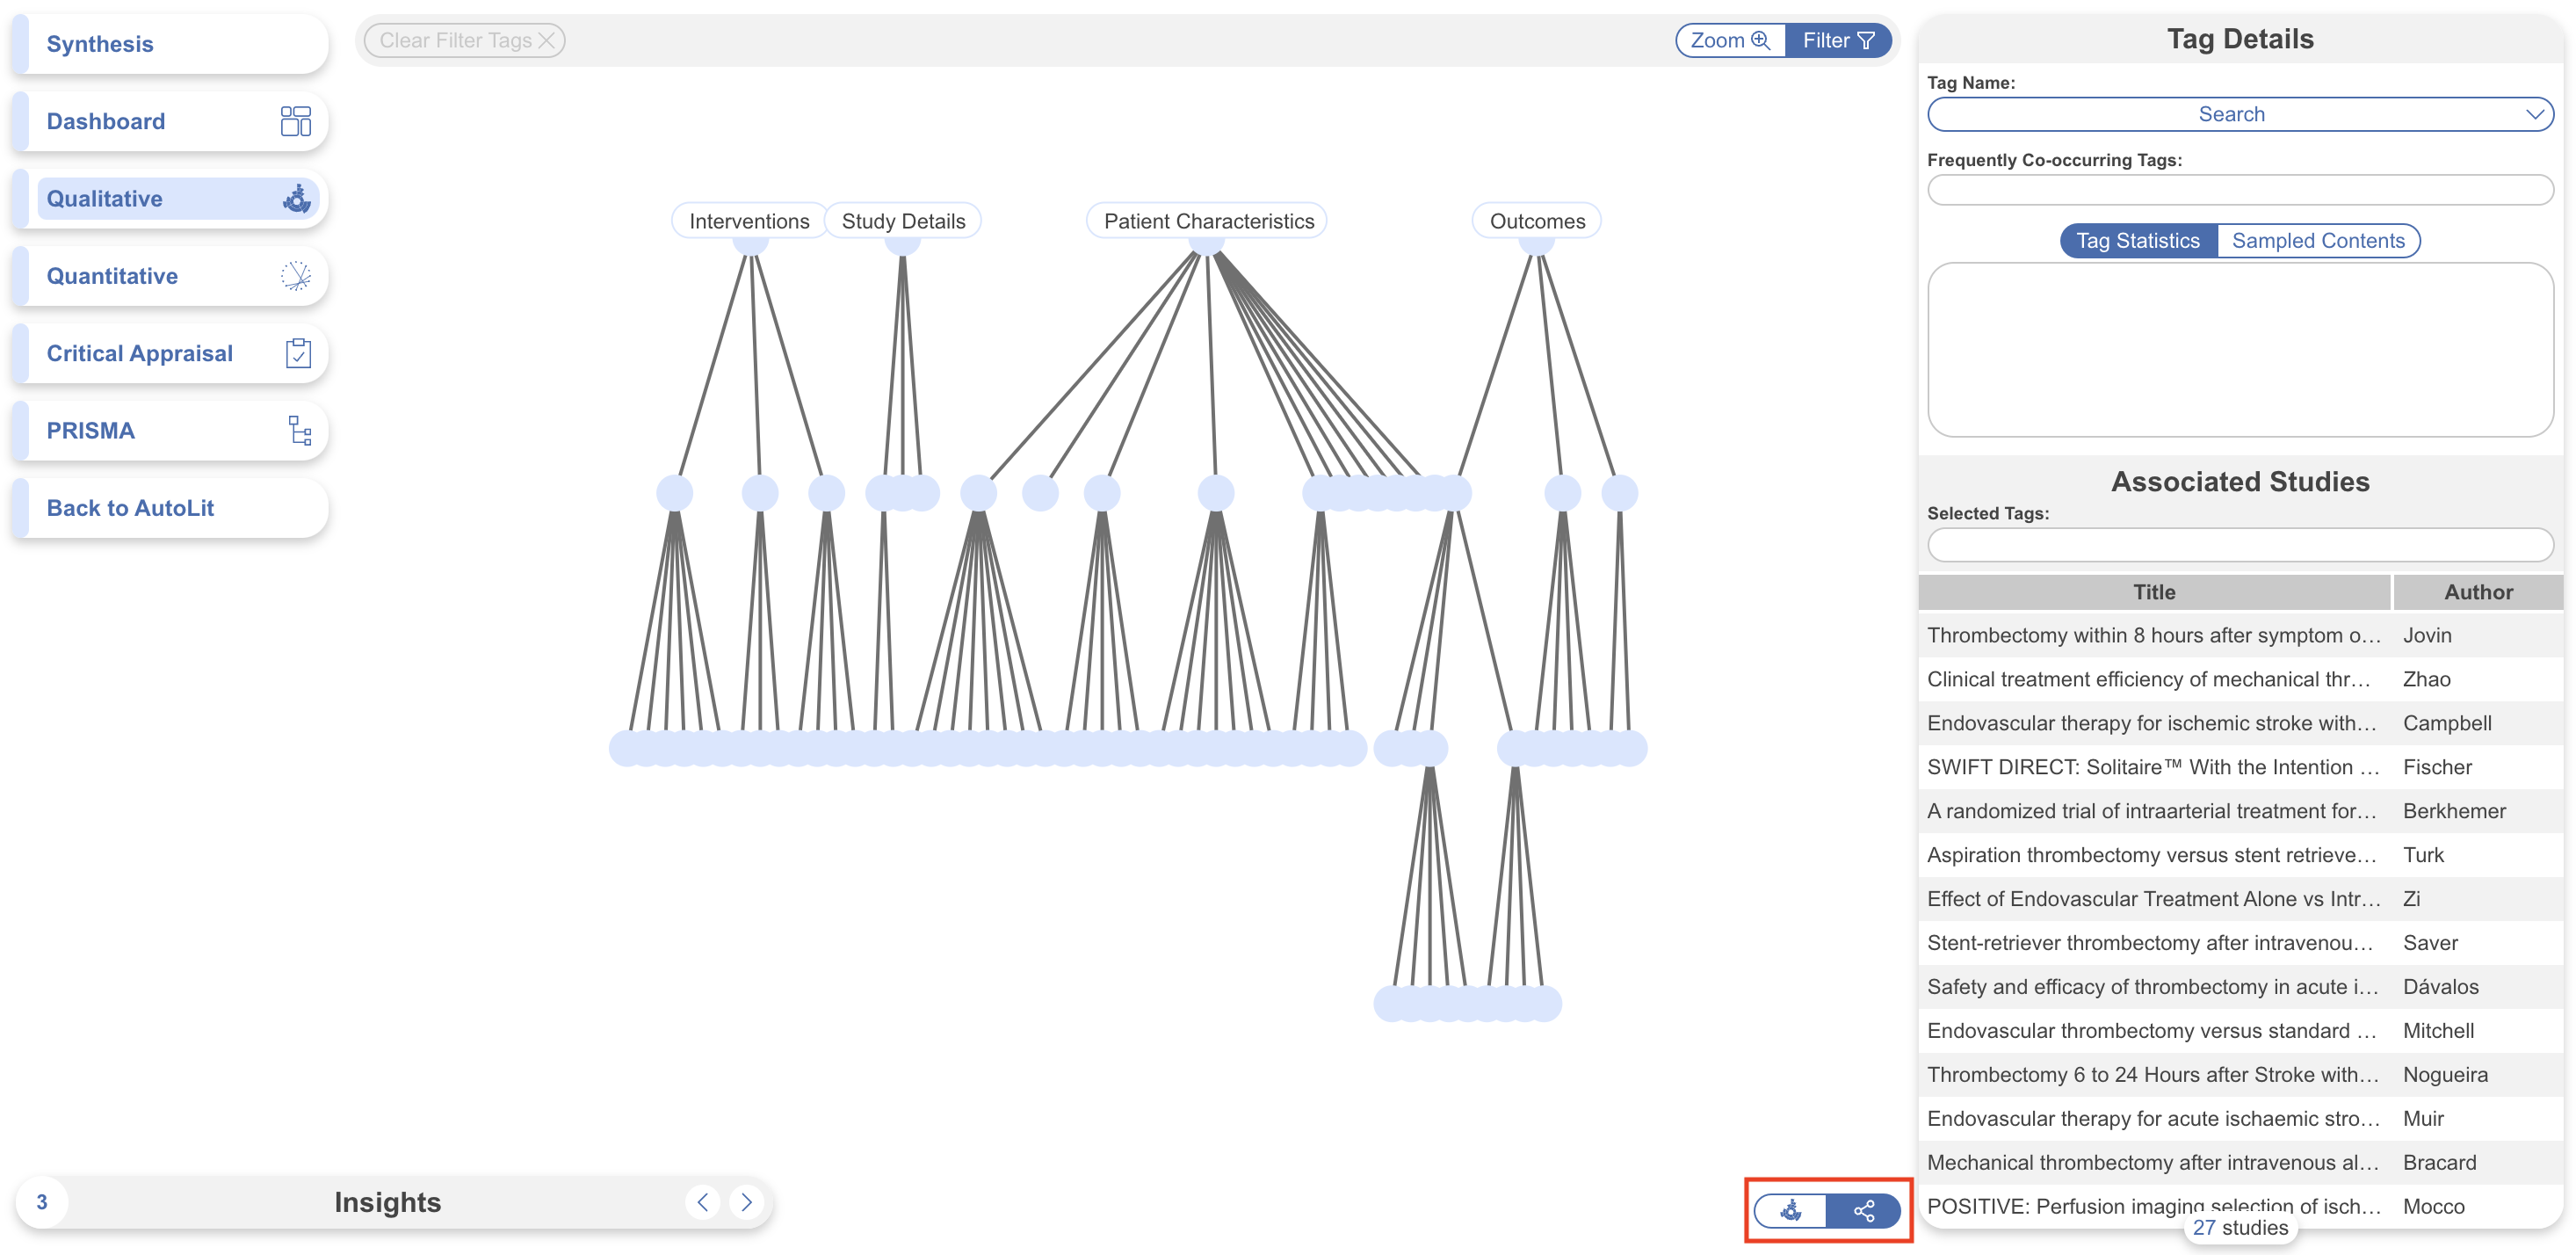
All features remain the same as in the sunburst, the only difference is the presentation.
Note: You can share and download filtered studies, but you cannot embed with this format currently.
Associated Studies
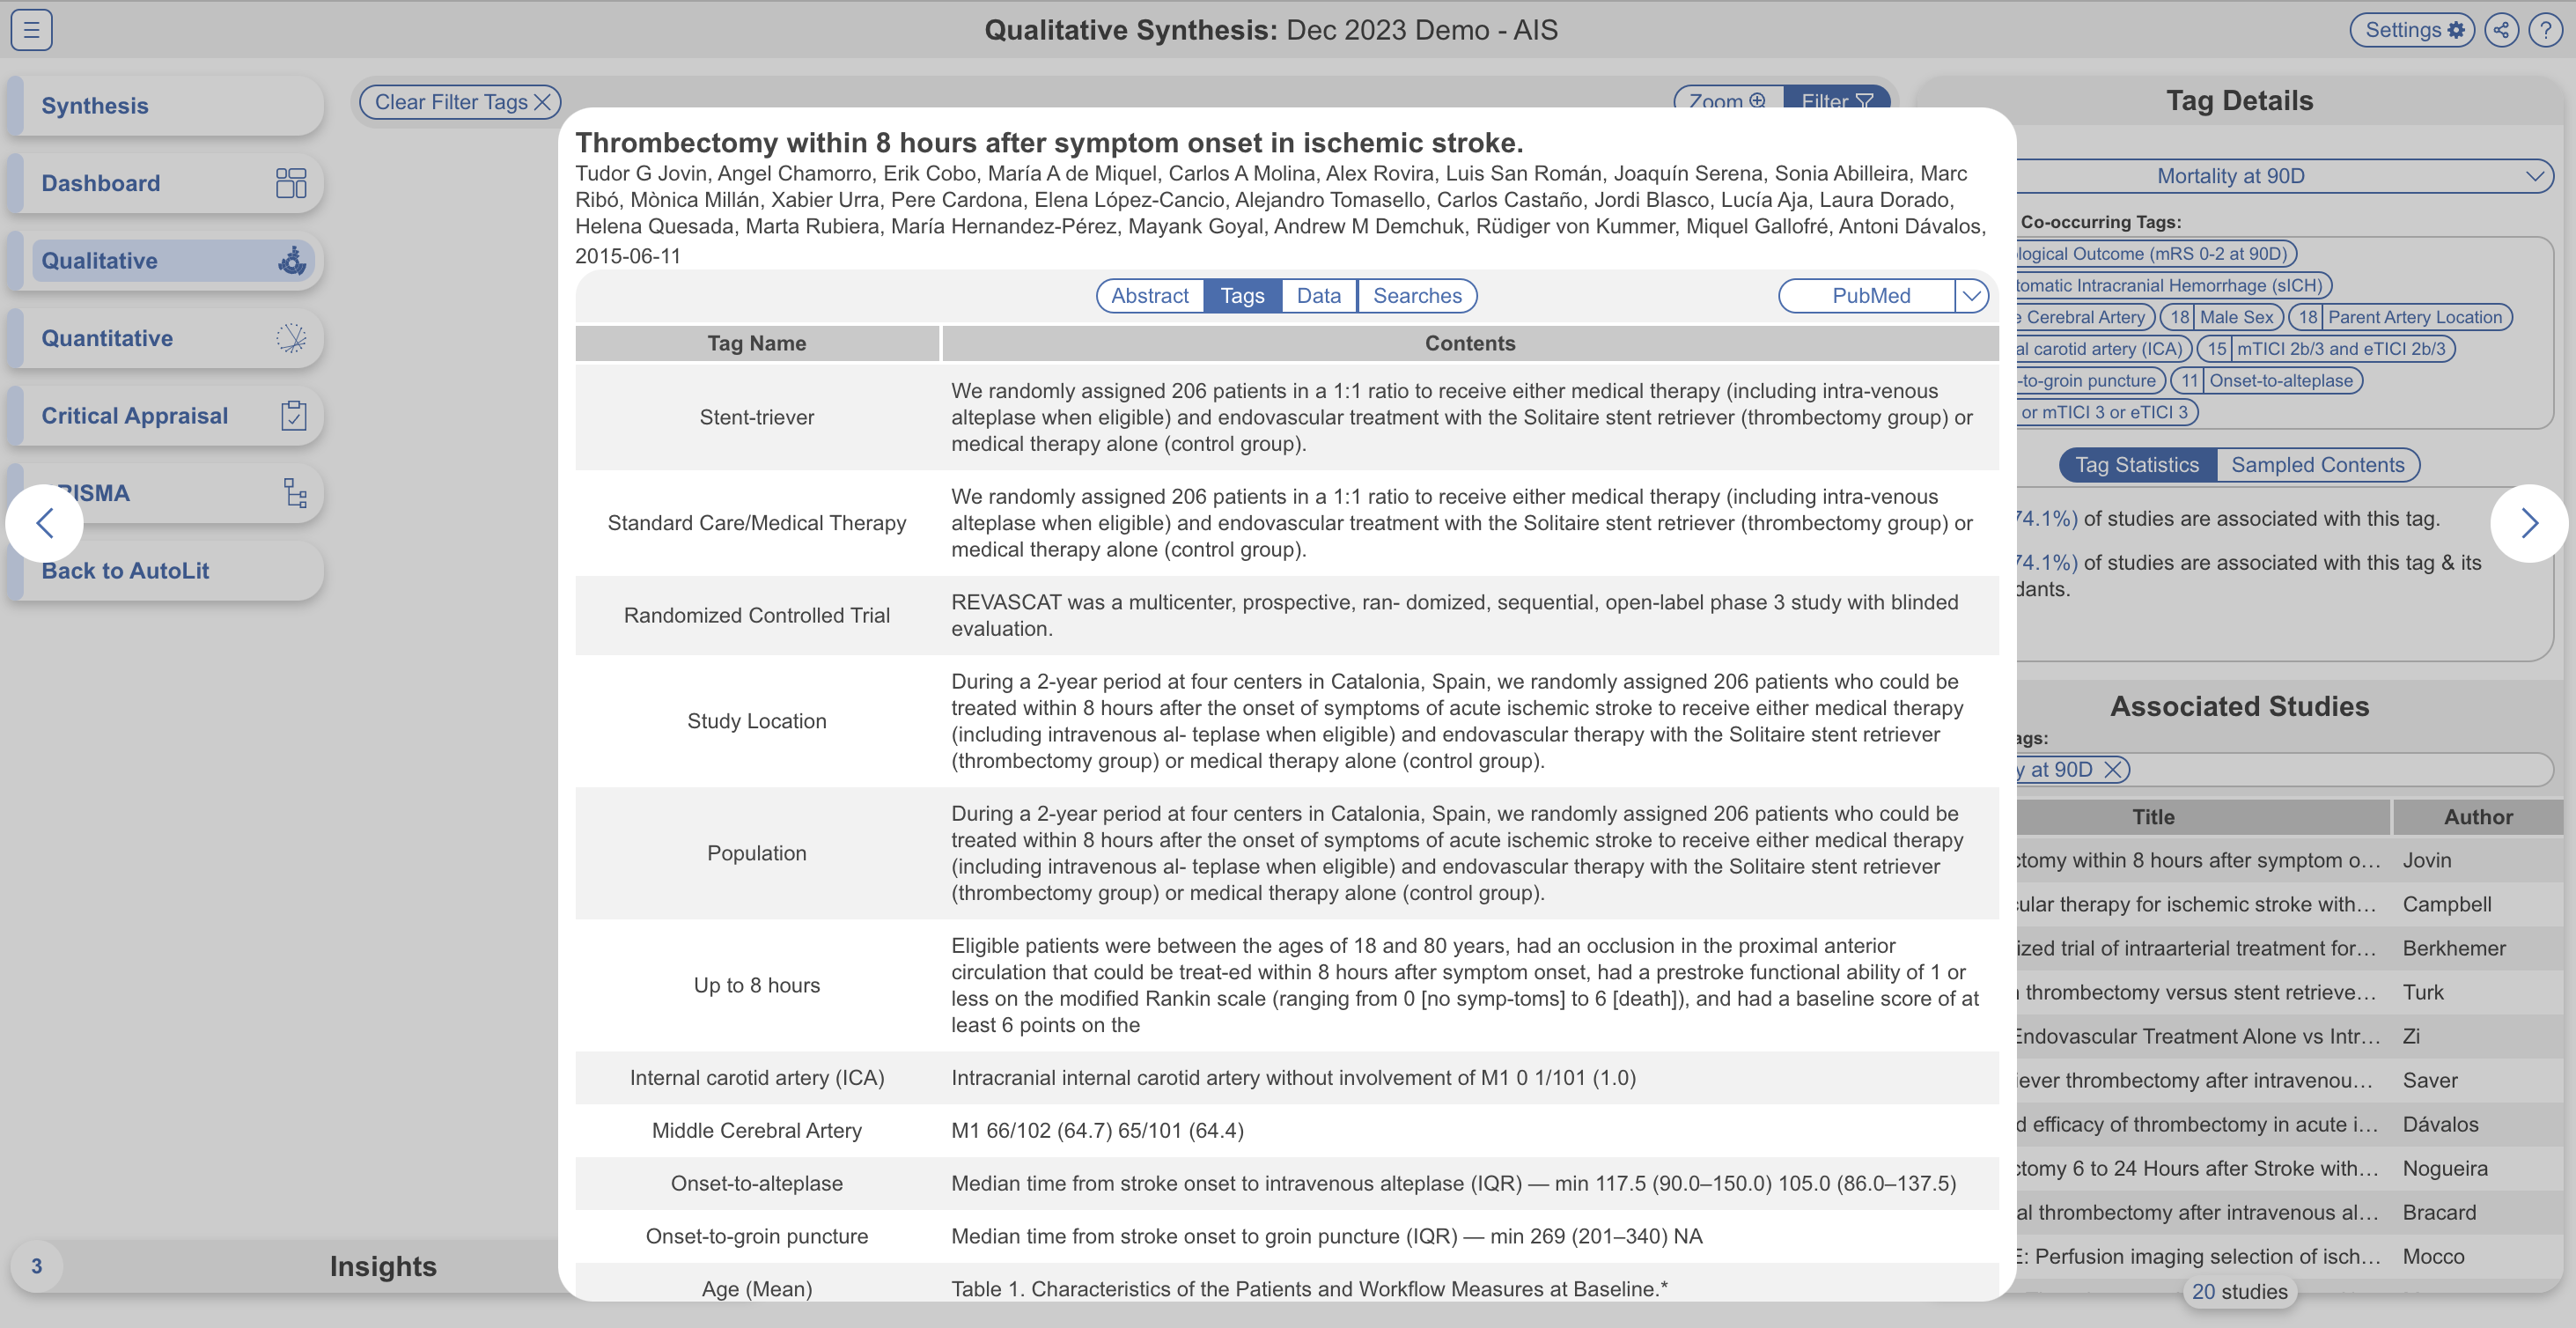
In both the sunburst and dendrogram view, when you click on a tag, you can view the associated studies on the right hand side. When clicking on a specific study, you can view the abstract, quantitative data, tags and searches corresponding to that study.
In the “Tags” tab, you can see a list of all tags and their contents. If your nest contains tags with table contents, the table will be shown here. However, this data can be exported in Study Inspector.
5. Share, Embed or Download
Share your Qualitative Synthesis page by clicking the Share icon in the upper right and a modal will appear:
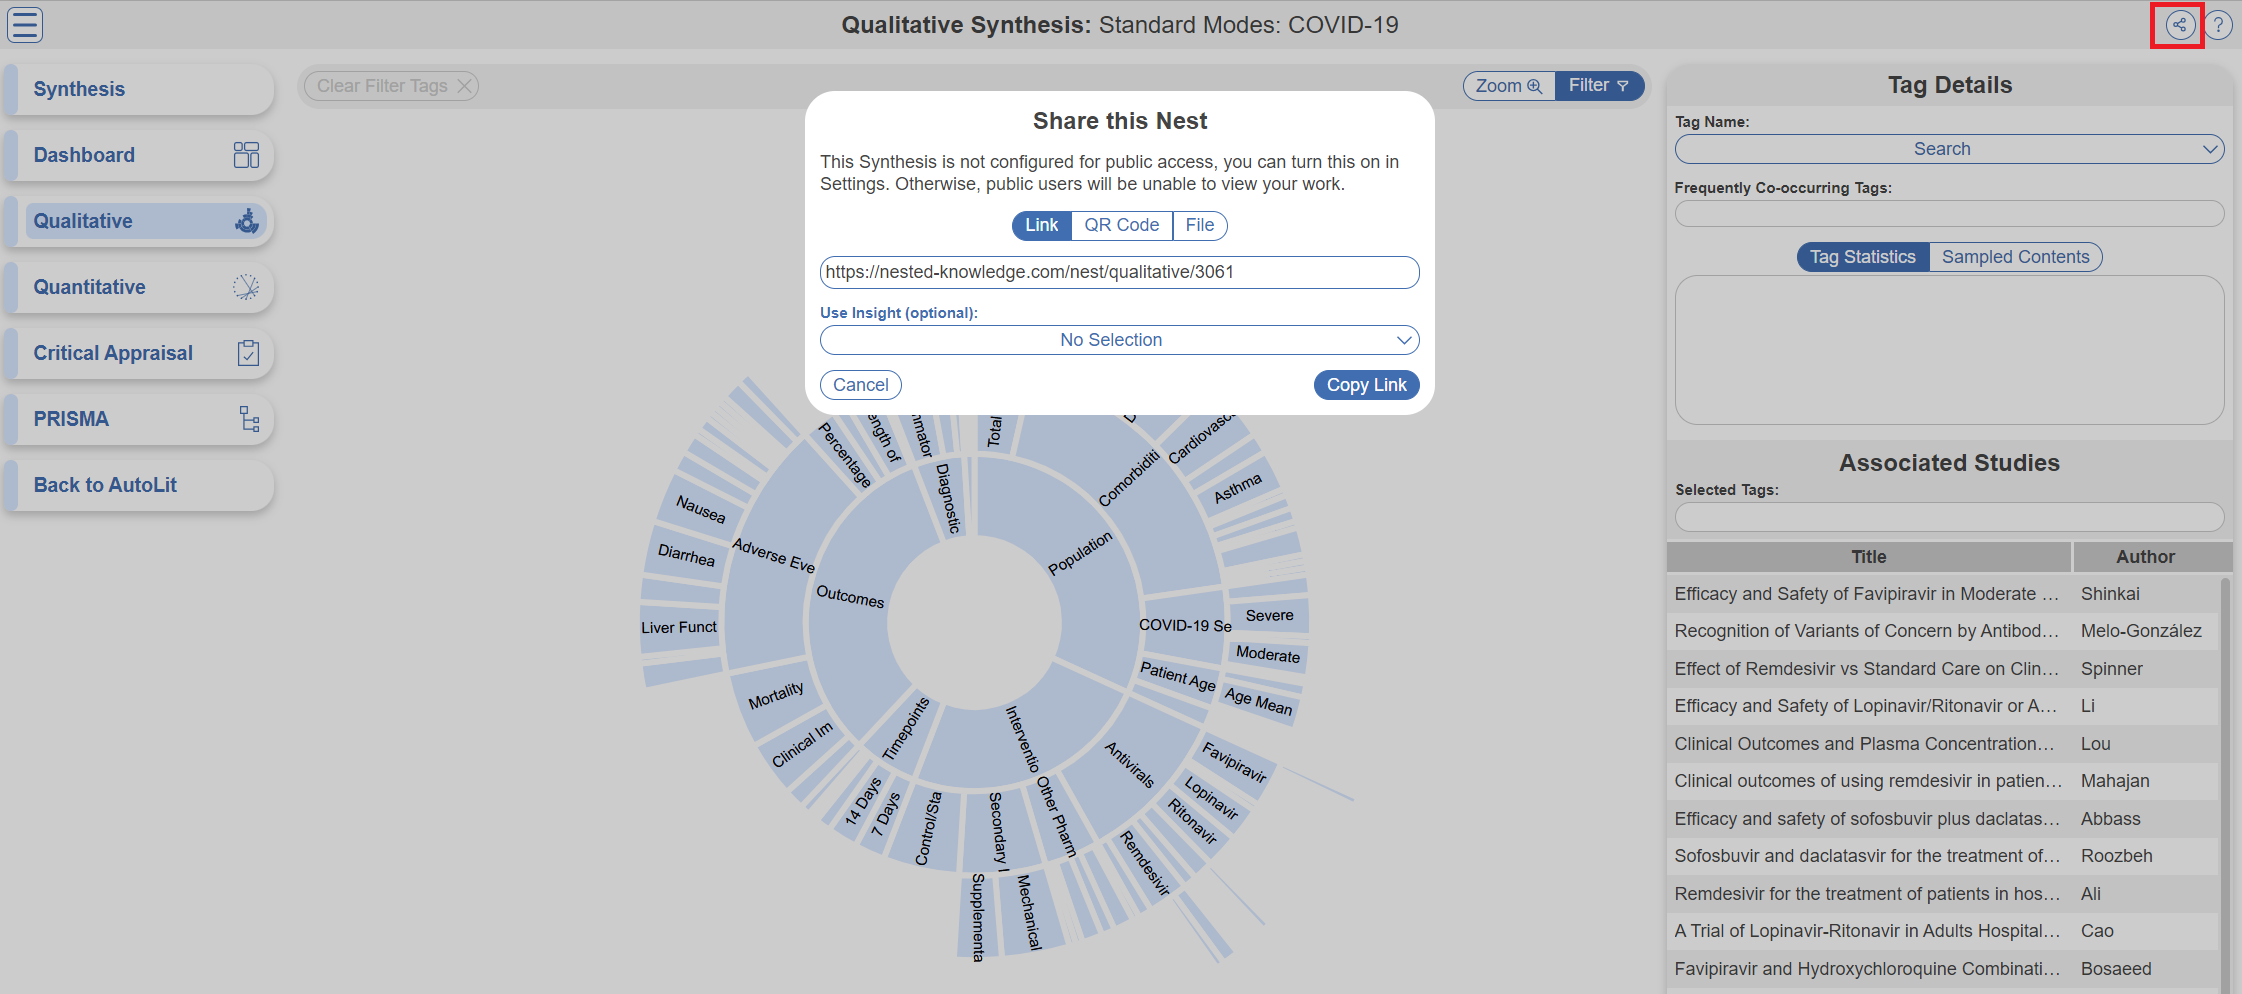
You have the choice of sharing the QLS page via a link or downloading a QR code. If you share the link directly from the QLS page, you will share this page directly; however, if link-shared, recipients will be able to view all Synthesis pages.
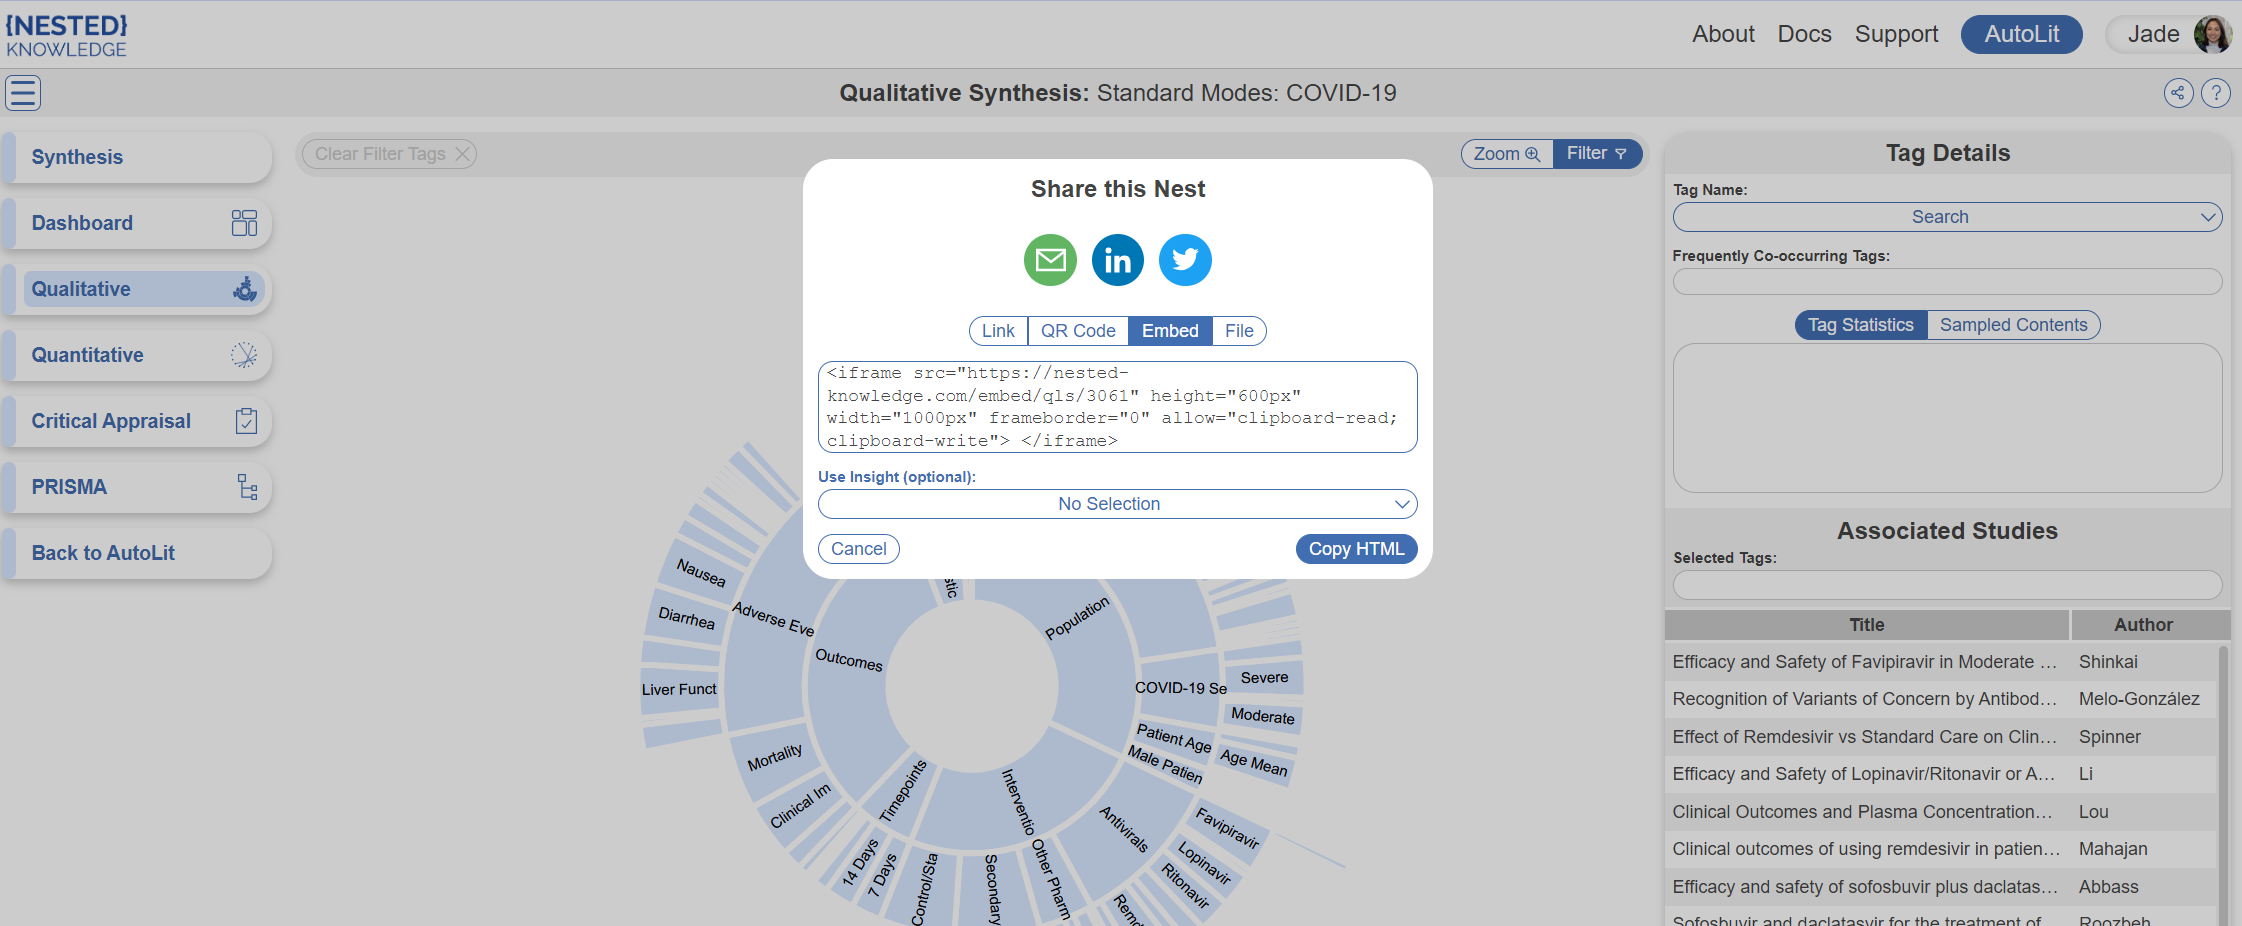
If your nest is public (see Settings to do so) you will also have the option to embed QLS into a webpage. Simply copy the HTML code and paste it into your site of choice.
Download Filtered Studies
In QLS only, in this same modal, you have the choice to download a curated spreadsheet of filtered studies and all tags reported using the “Share” function. In the upper right, click the “Share” button, under the “File” menu, click “Download Filtered Studies.”
Note: If no tags are selected, the spreadsheet will contain all studies and all tags. If certain tags are selected, the spreadsheet will only contain those filtered studies and their tags.