Table of Contents
Synthesis
Once your Nest is complete, the data will be viewable and you can export the data for analysis. NK's Synthesis feature allows you to view the data through Qualitative Synthesis and Quantitative Synthesis depending on the end goal.
Basics of Synthesis
In short, Synthesis contains the outputs of the living review, divided into several pages, including Qualitative Synthesis (the output from Tagging), Quantitative Synthesis (the output of Meta-analytical Extraction), and a PRISMA diagram (the record of Screening), as well as configurable/customizable Dashboards. See the video here or the text below for details!
Navigating Synthesis
Synthesis Home lists the Contributors and Description, and then enables you to access the nest outputs (Qualitative Synthesis, Quantitative Synthesis, and Manuscript, in the left-hand menu column). Methodological details and outputs (specifically, PRISMA and Risk of Bias outputs) can also be here.
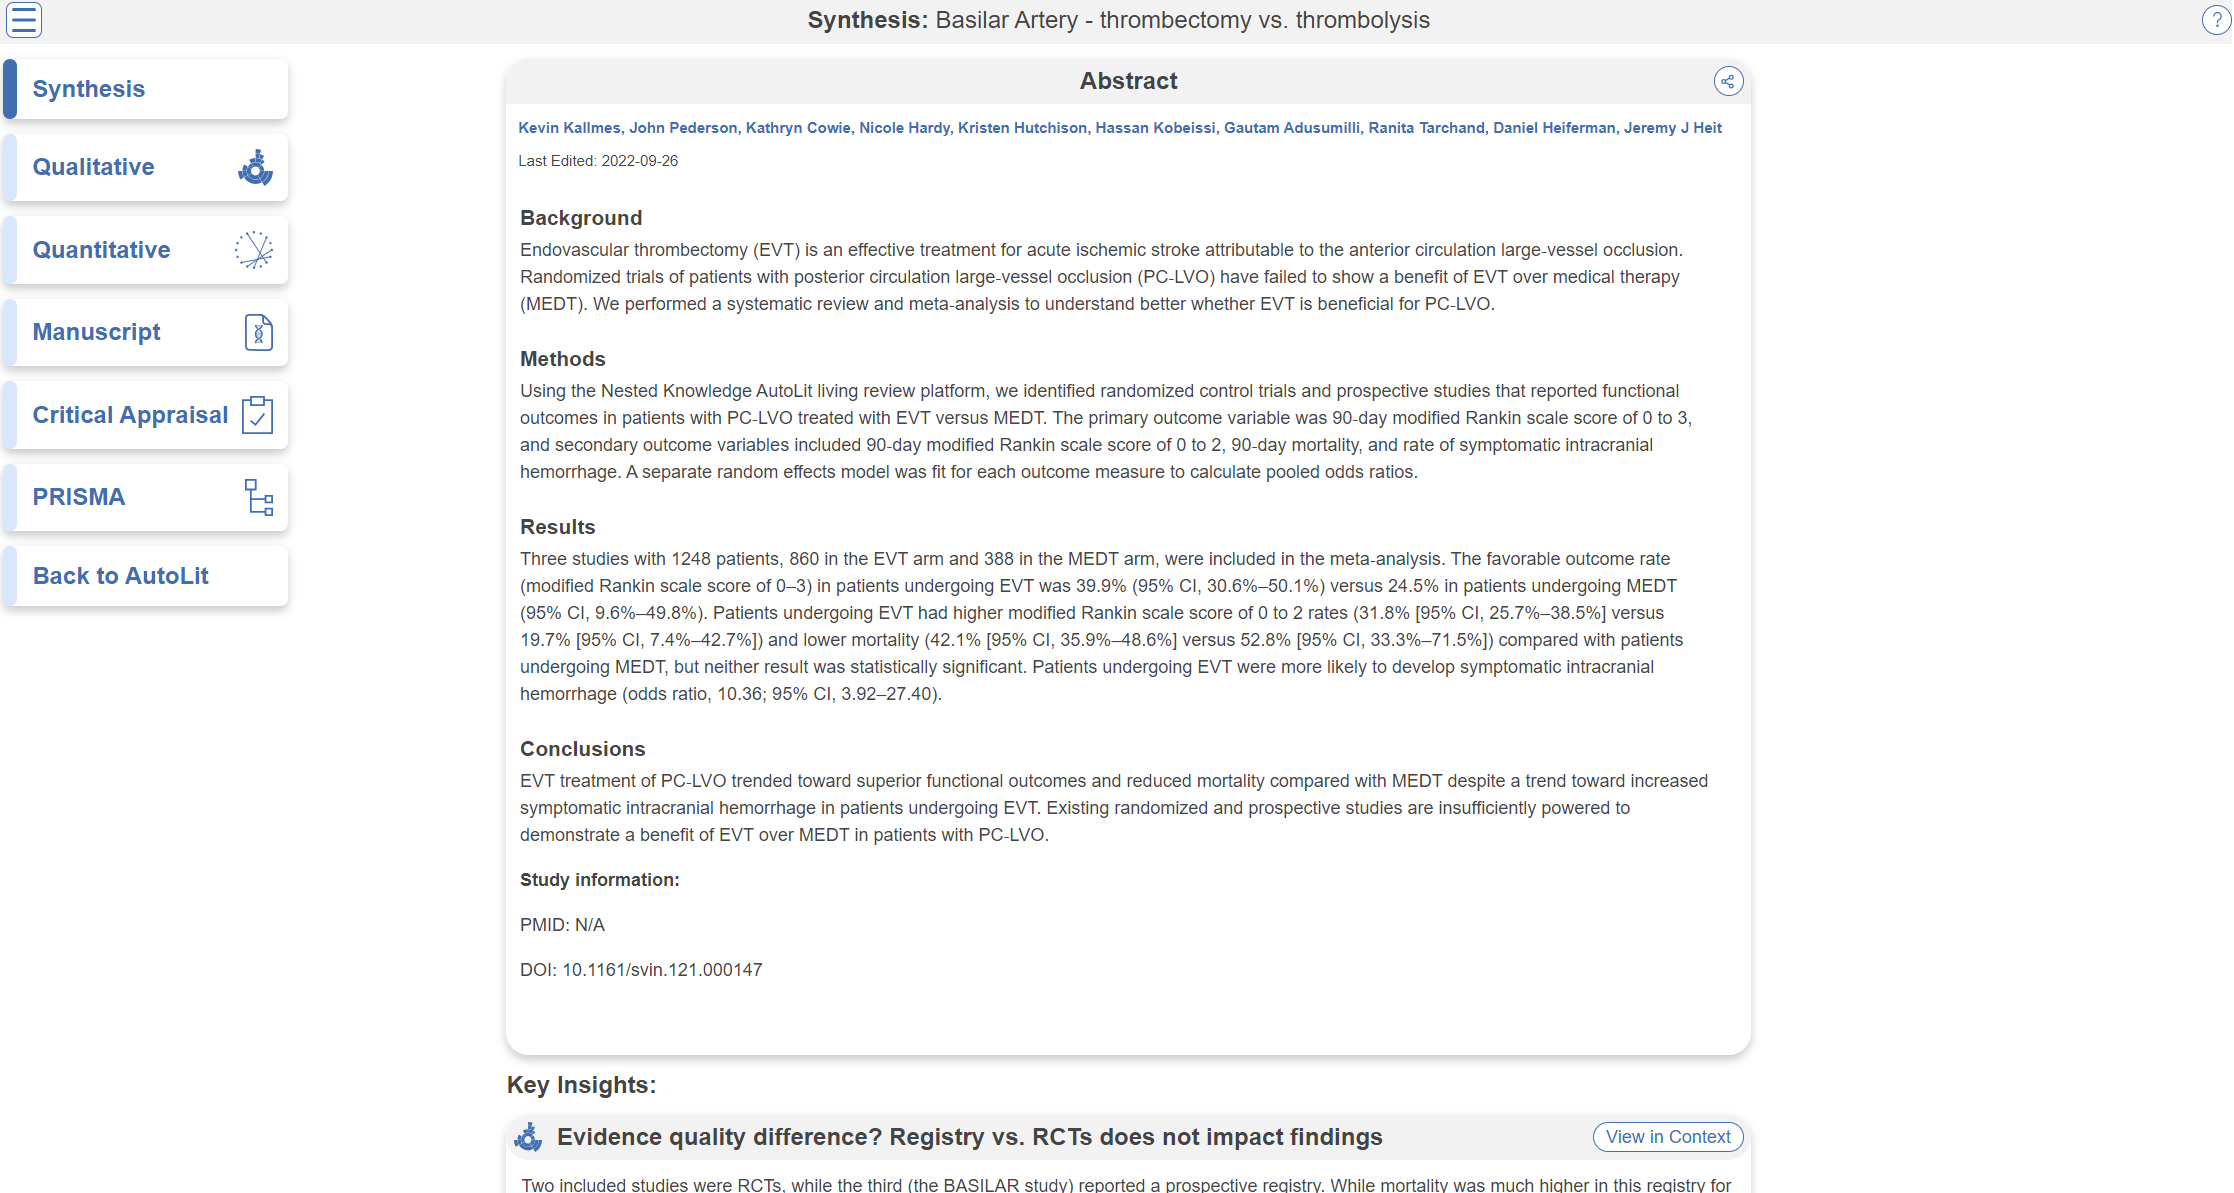
To navigate back to the AutoLit for that specific nest, click the “Back to AutoLit”, the last mitem at the bottom of the left-hand menu. Unlike the blue AutoLit button in the top menu (next to your name), which takes you back to a listing of all of your nests, the “Back to AutoLit” button will take you to the AutoLit for the specific nest you are viewing. This button is only visible to users with AutoLit access to that specific nest.
Qualitative Synthesis
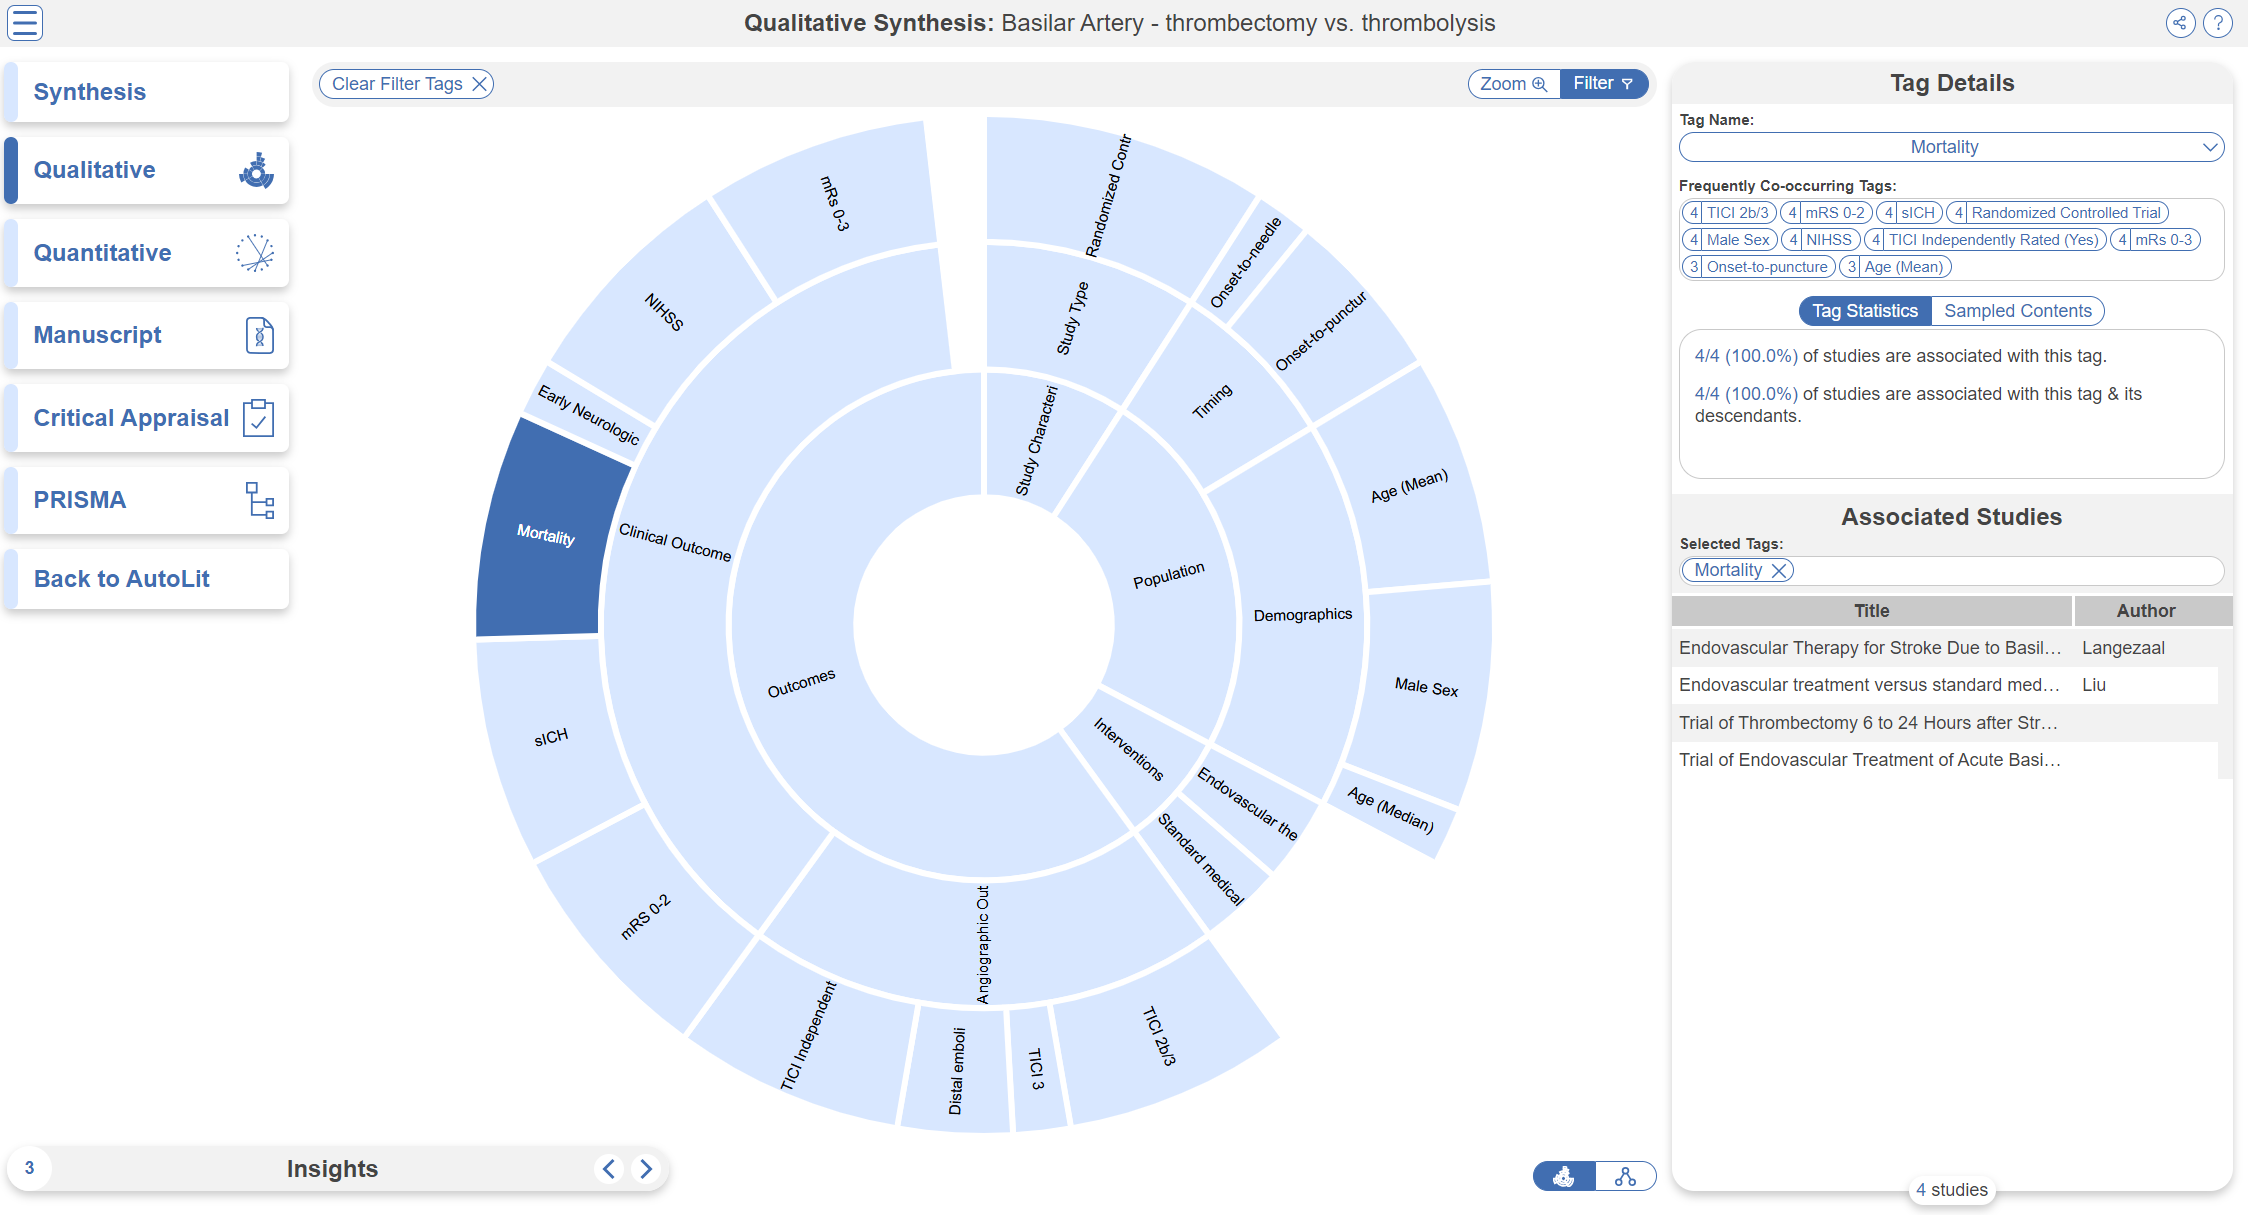
In Qualitative Synthesis, you can examine the tags associated with studies in a nest in an interactive, filterable sunburst diagram or dendrogram with direct access to each study's abstract, data, and tags.
Quantitative Synthesis
In Quantitative Synthesis, you can view data outputs from Meta-Analytical Extraction.

Insights
On Qualitative Synthesis (and, coming soon, on Quantitative Synthesis), specific Insights can be identified with a title, text, and pre-configured diagram!
Manuscript
Manuscript presents written background, methods, findings, and discussion related to the nest.
Dashboard
Dashboard presents your findings via custom data cards: text, tables, images, studies, and PRISMA.
Methods-Related Visuals
Nested Knowledge also generates methods-related visuals automatically:
PRISMA Chart
Specifically, a PRISMA Chart is generated to give a history of all Search and Screening activities.
Critical Appraisal Visuals
An interactive Critical Appraisal Visual page contains your Domain Distribution and Stoplight diagrams.
Share, Embed or Download
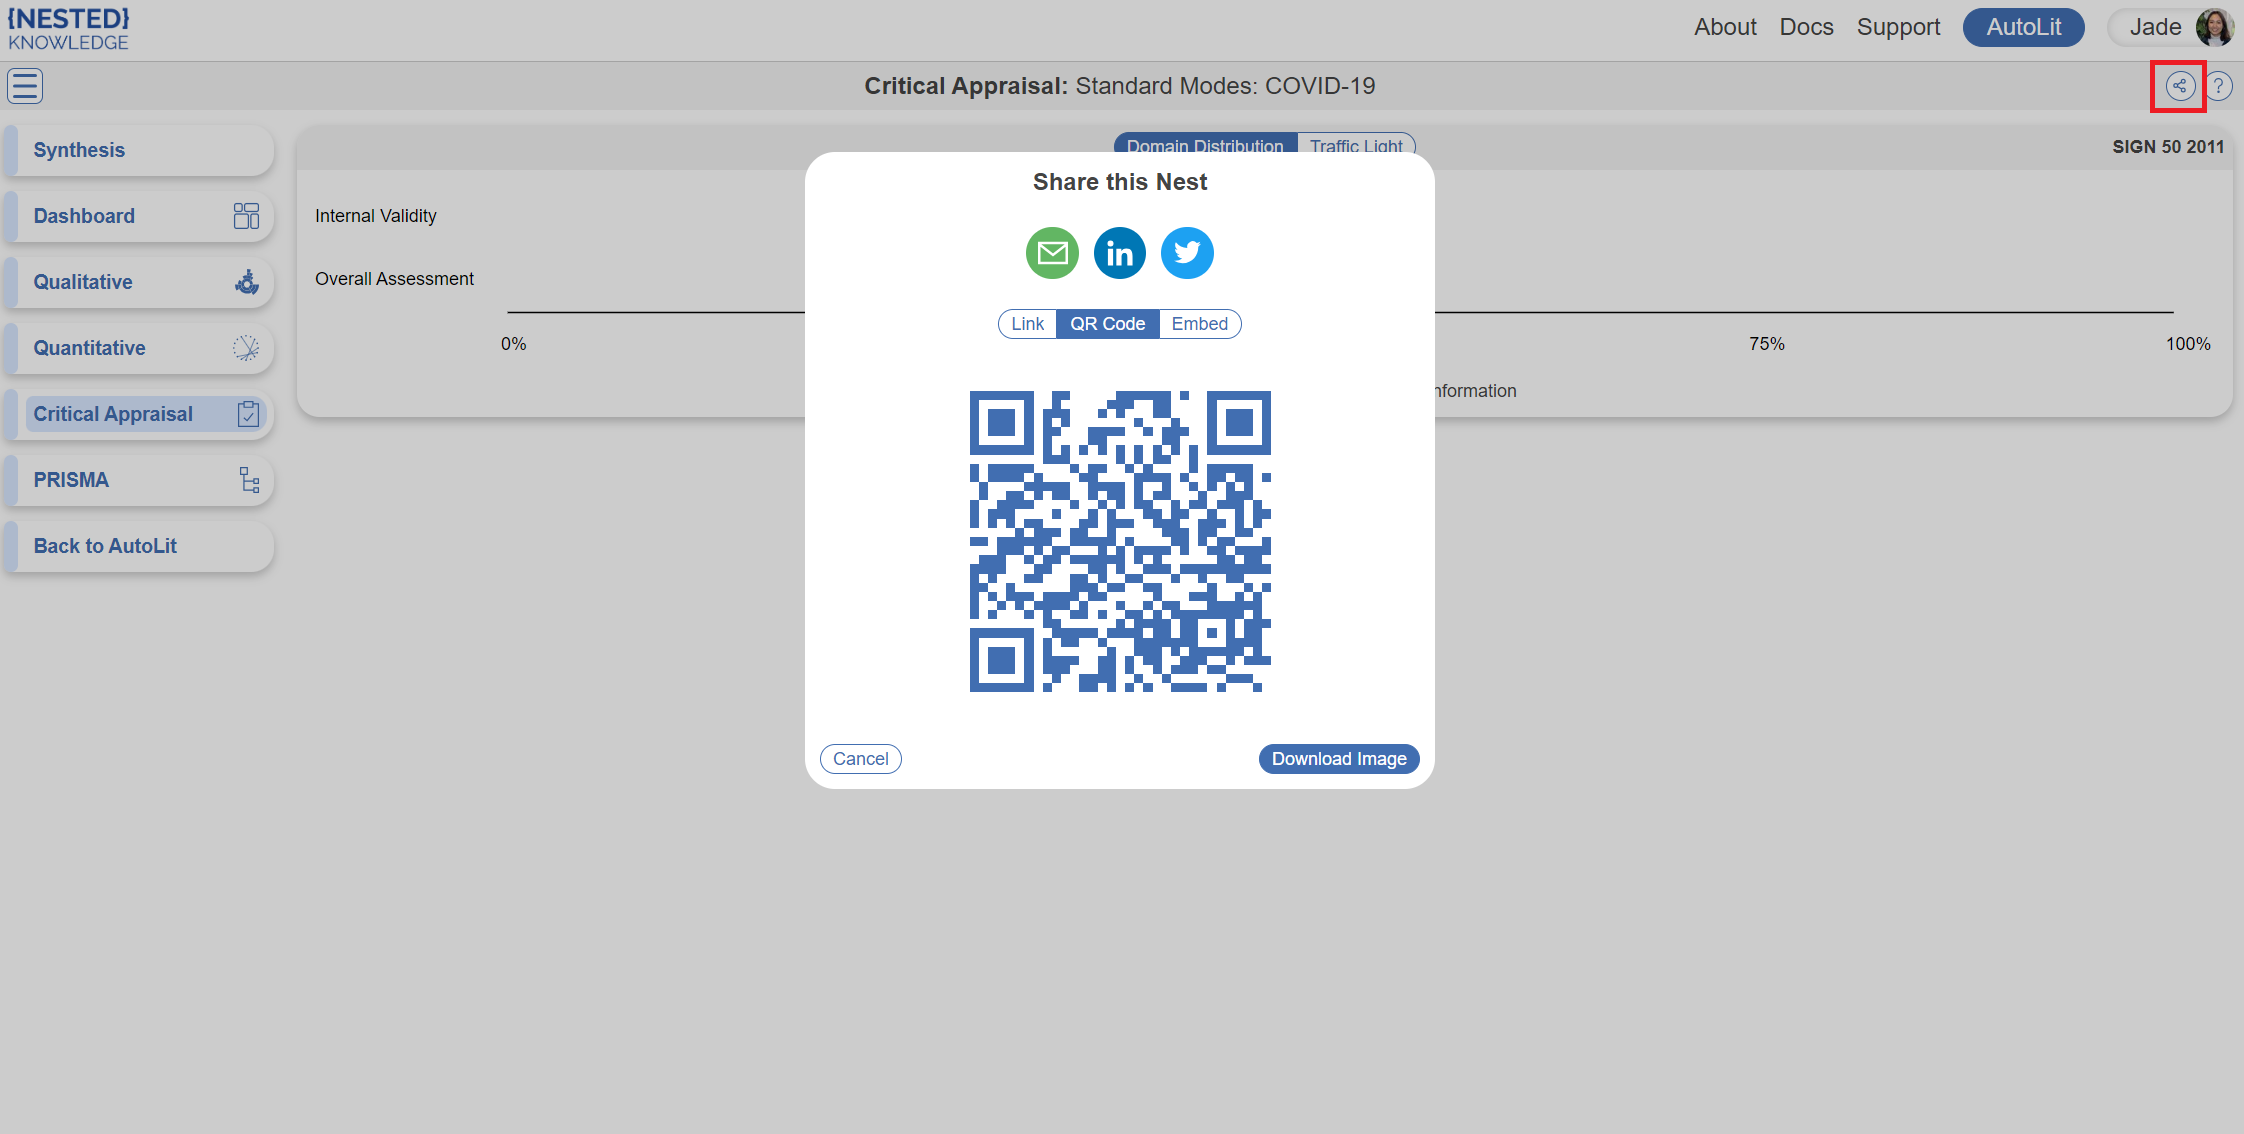
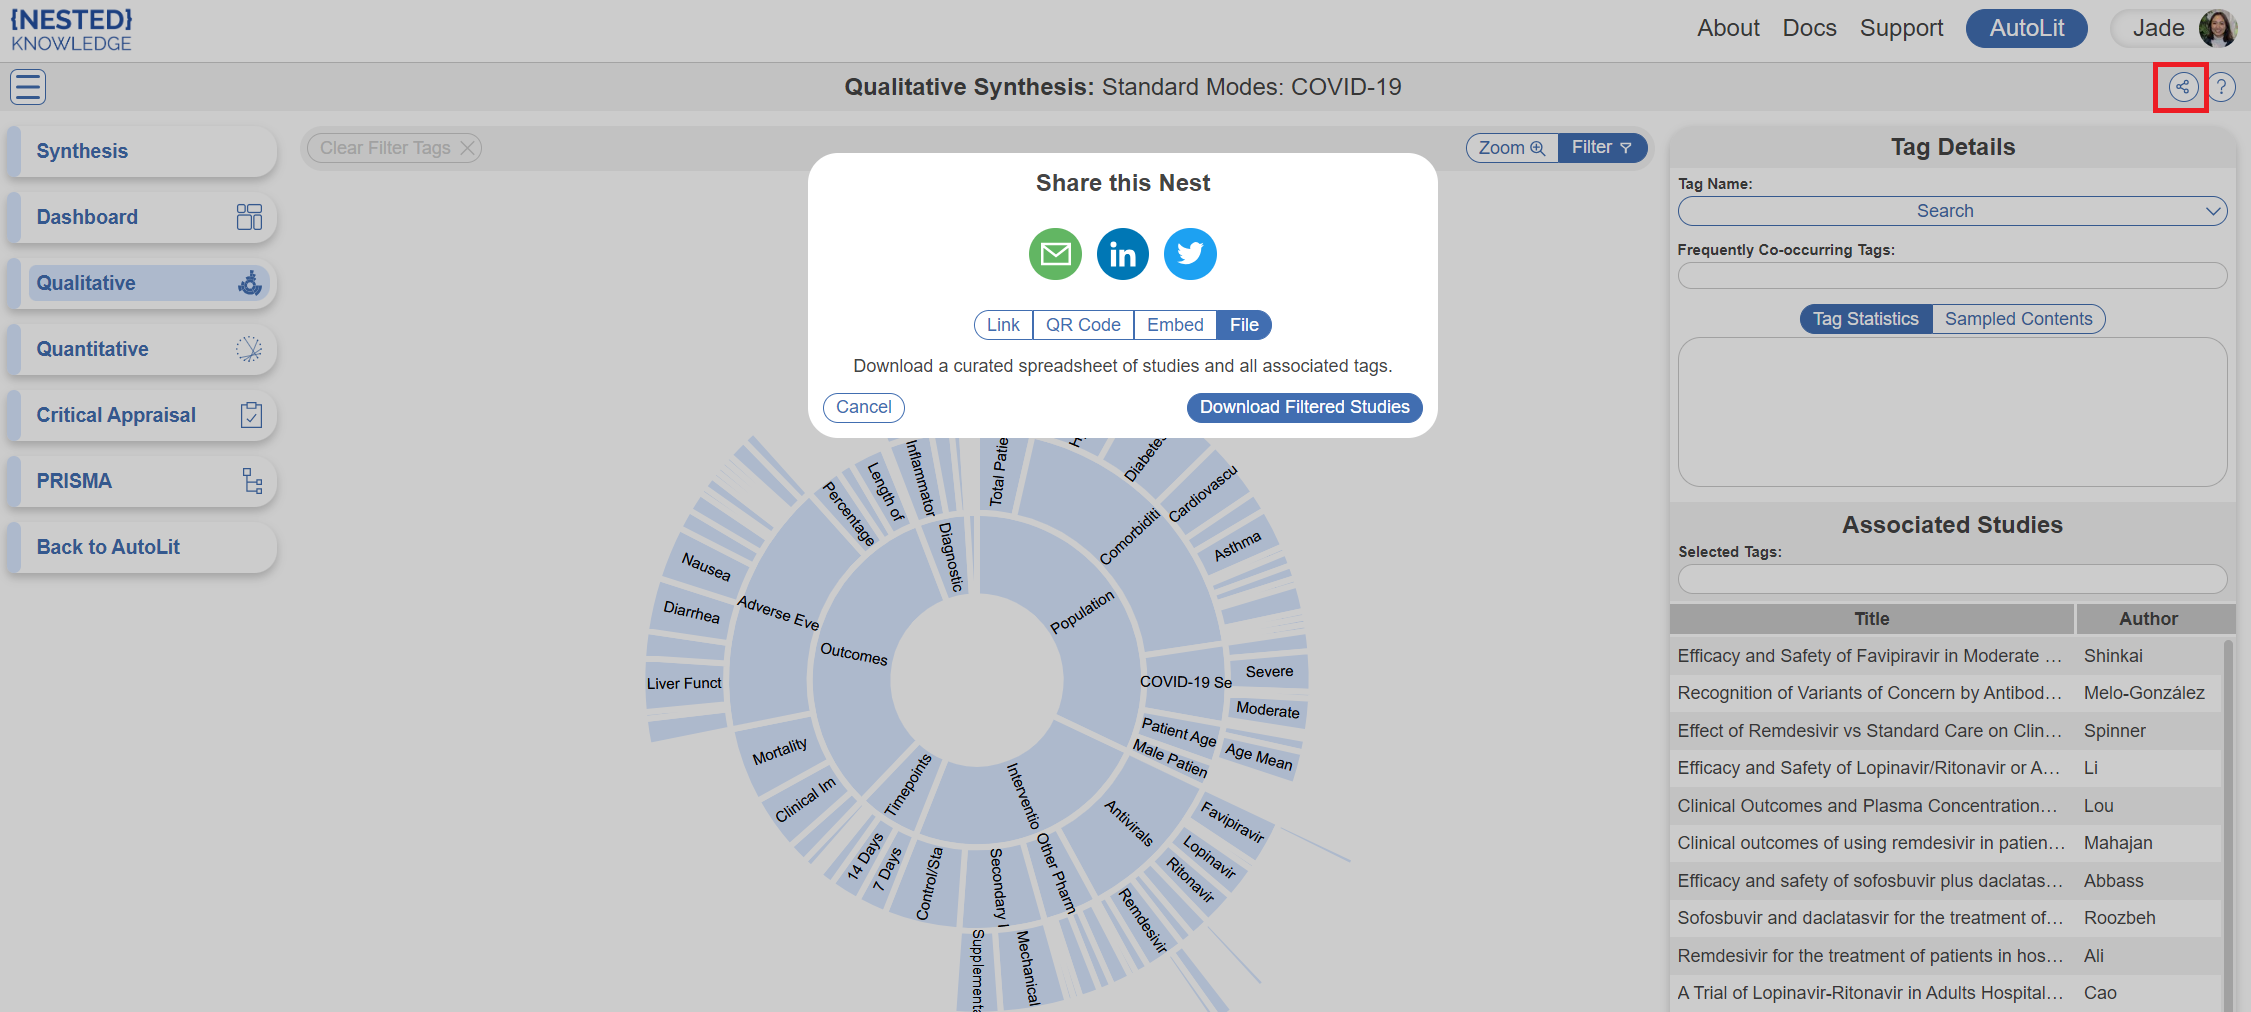
Within all parts of Synthesis (Dashboard, Manuscript, QLS, QNS, Critical Appraisal and PRISMA) you may share and embed the visuals. To do this, navigate to your Synthesis output of choice, and click the share button in the top right. A modal will open offering the link to share the page, a unique QR code, and the HTML code to use for embedding the output on your site of choice, provided your Synthesis is public (see Settings).
Note, when Synthesis is embedded on a site, the sharing capabilities is maintained.
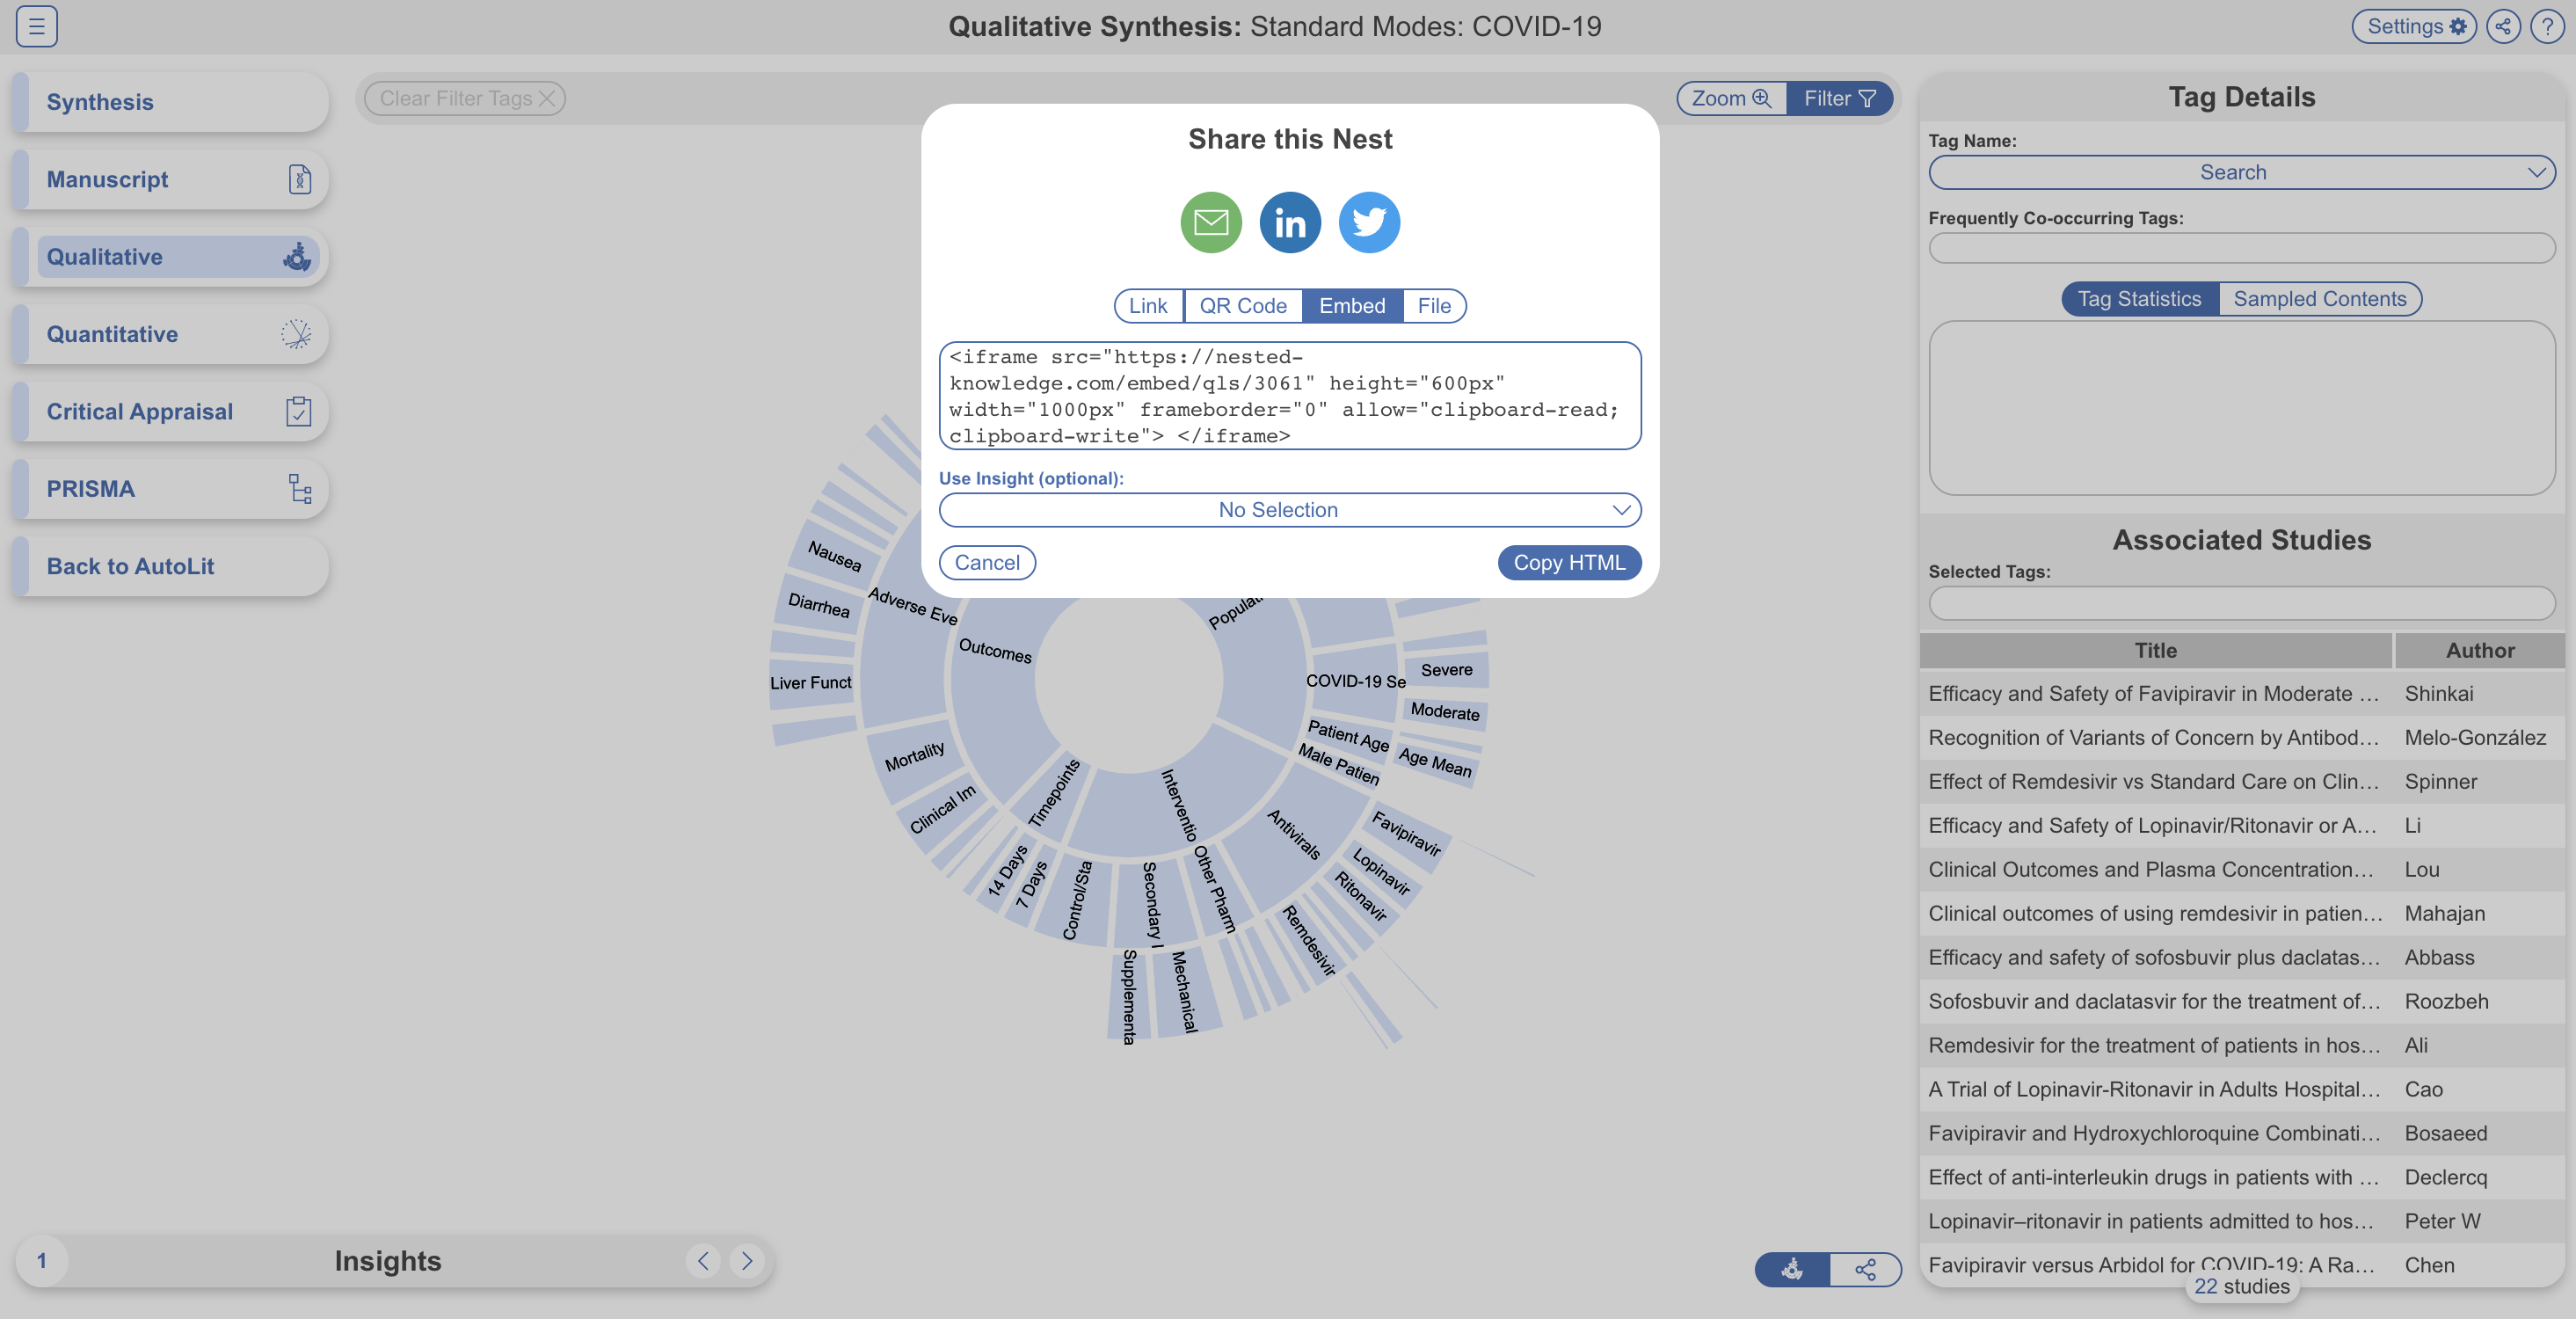
In QLS, you have the additional ability to download a spreadsheet of filtered studies. This is often helpful for external viewers to alternatively visualize the data but don't worry, any admin in the nest can still access all data (not just qualitative) and download them as spreadsheets in Study Inspector –> Download.
Filtering Synthesis
In QLS, QNS, Critical Appraisal and PRISMA outputs, filters can be applied via the Settings button in the top right. These filters work similarly to Study Inspector, allowing you to filter to specific sets of studies to be shown. Learn more about filters on Synthesis.
Synthesis AI Disclosure
The AI Disclosure Policy describes how AI is used in Synthesis and elsewhere in Nested Knowledge. We are committed to transparency on the use of AI in generating research outputs.