Nested Knowledge

Bringing Systematic Review to Life

User Tools

Site Tools


wiki:autolit:screening:inclusionpredictionmodel

This is an old revision of the document!


Inclusion Prediction Model

Configuration Options

To learn about configuration settings, which enable you to toggle Manual updating vs. Automatic and Displayed vs. Hidden, see the Settings page.

How Inclusion Predictions Works

The Inclusion Prediction Model learns from your screening activity on the specific nest you are Screening. It compares the metadata and Abstract content between Included and Excluded records, checks its own accuracy, and then provides a prediction about how likely each Unscreened record is to be Included.

Running the Inclusion Model

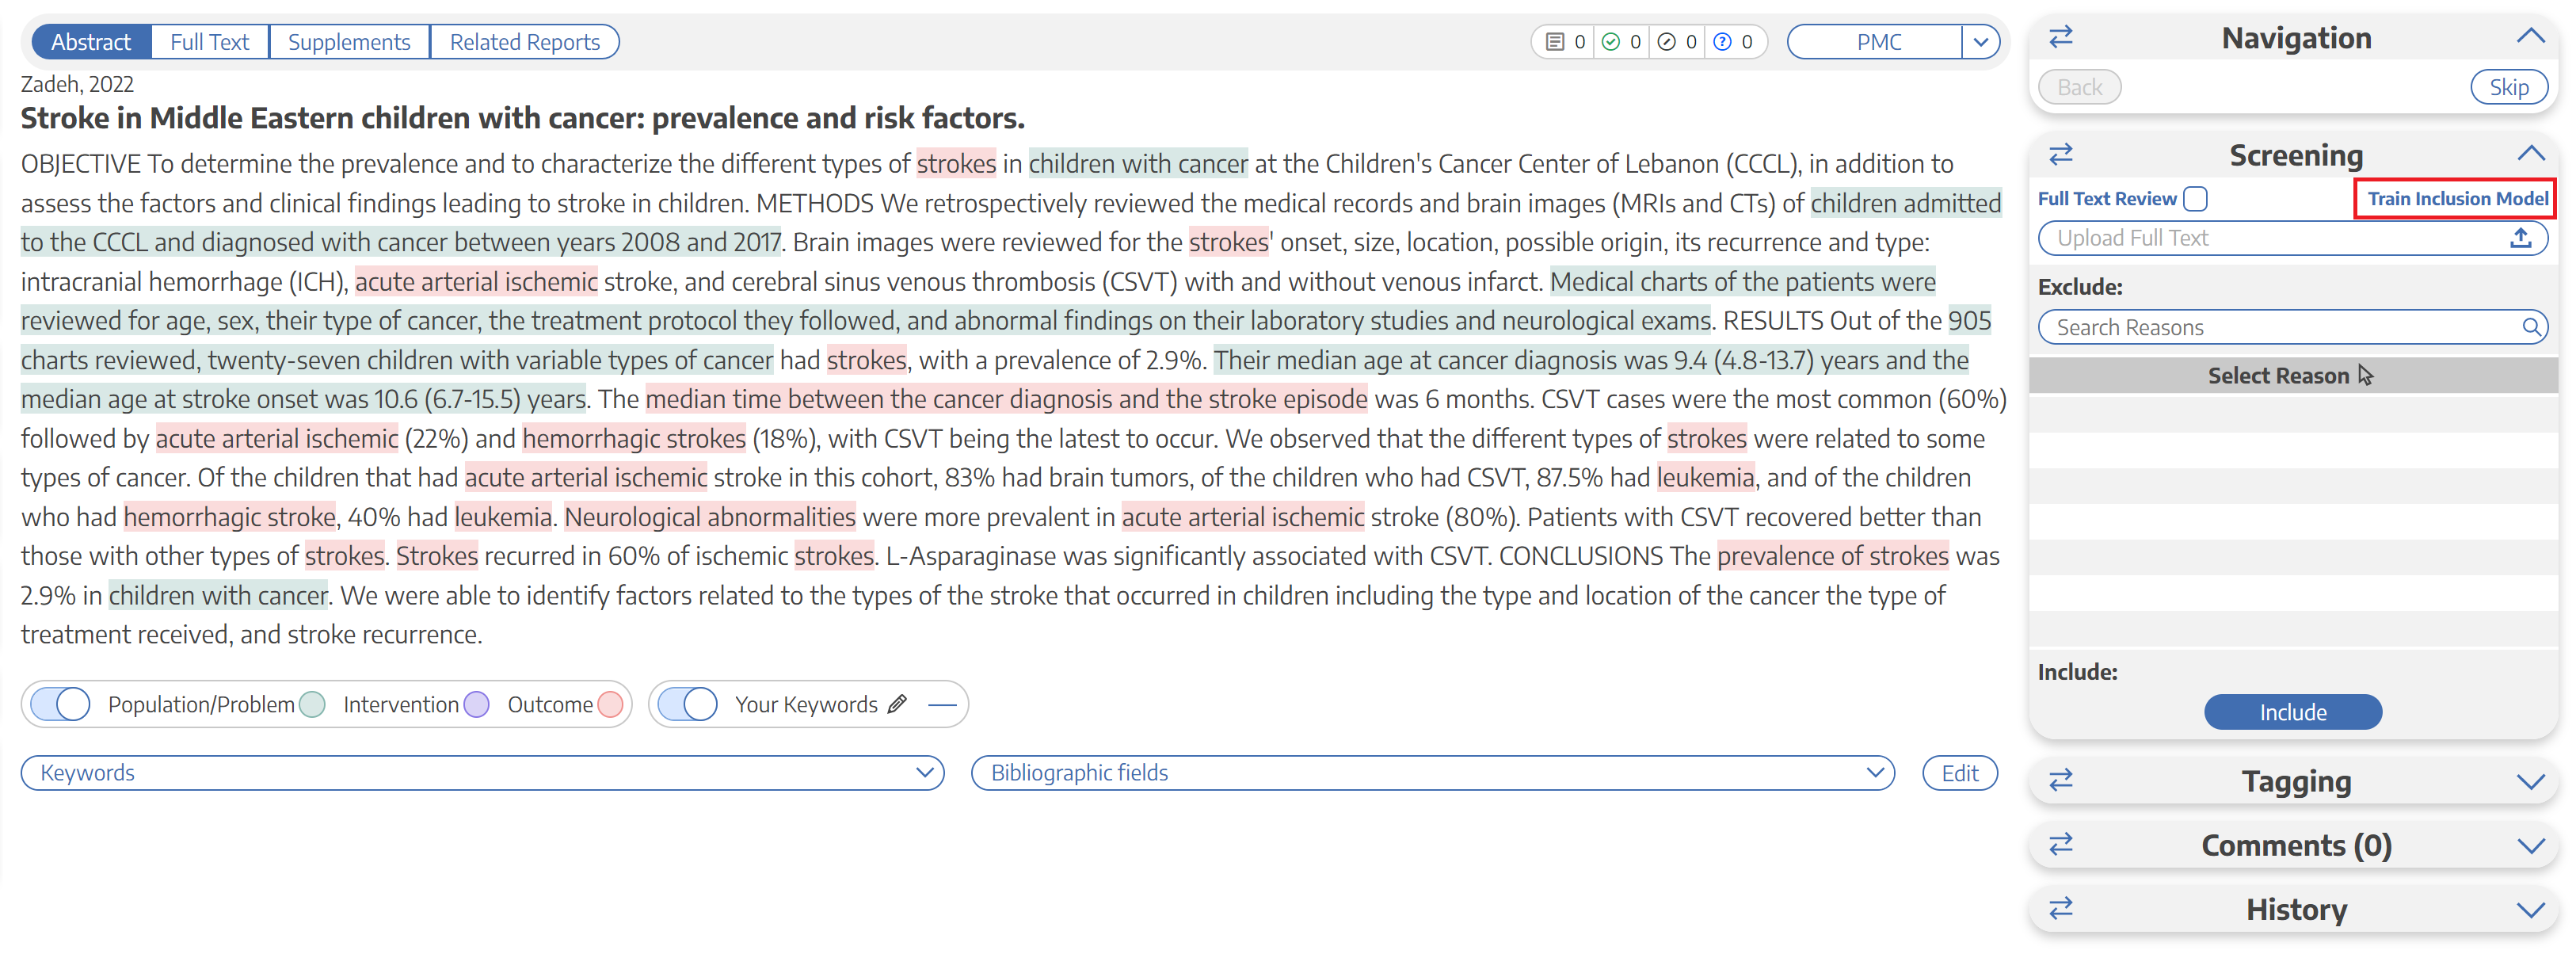
In its default setting, the Inclusion Model must be run manually. To do so, click “Train Inclusion Model” on the Screening panel:

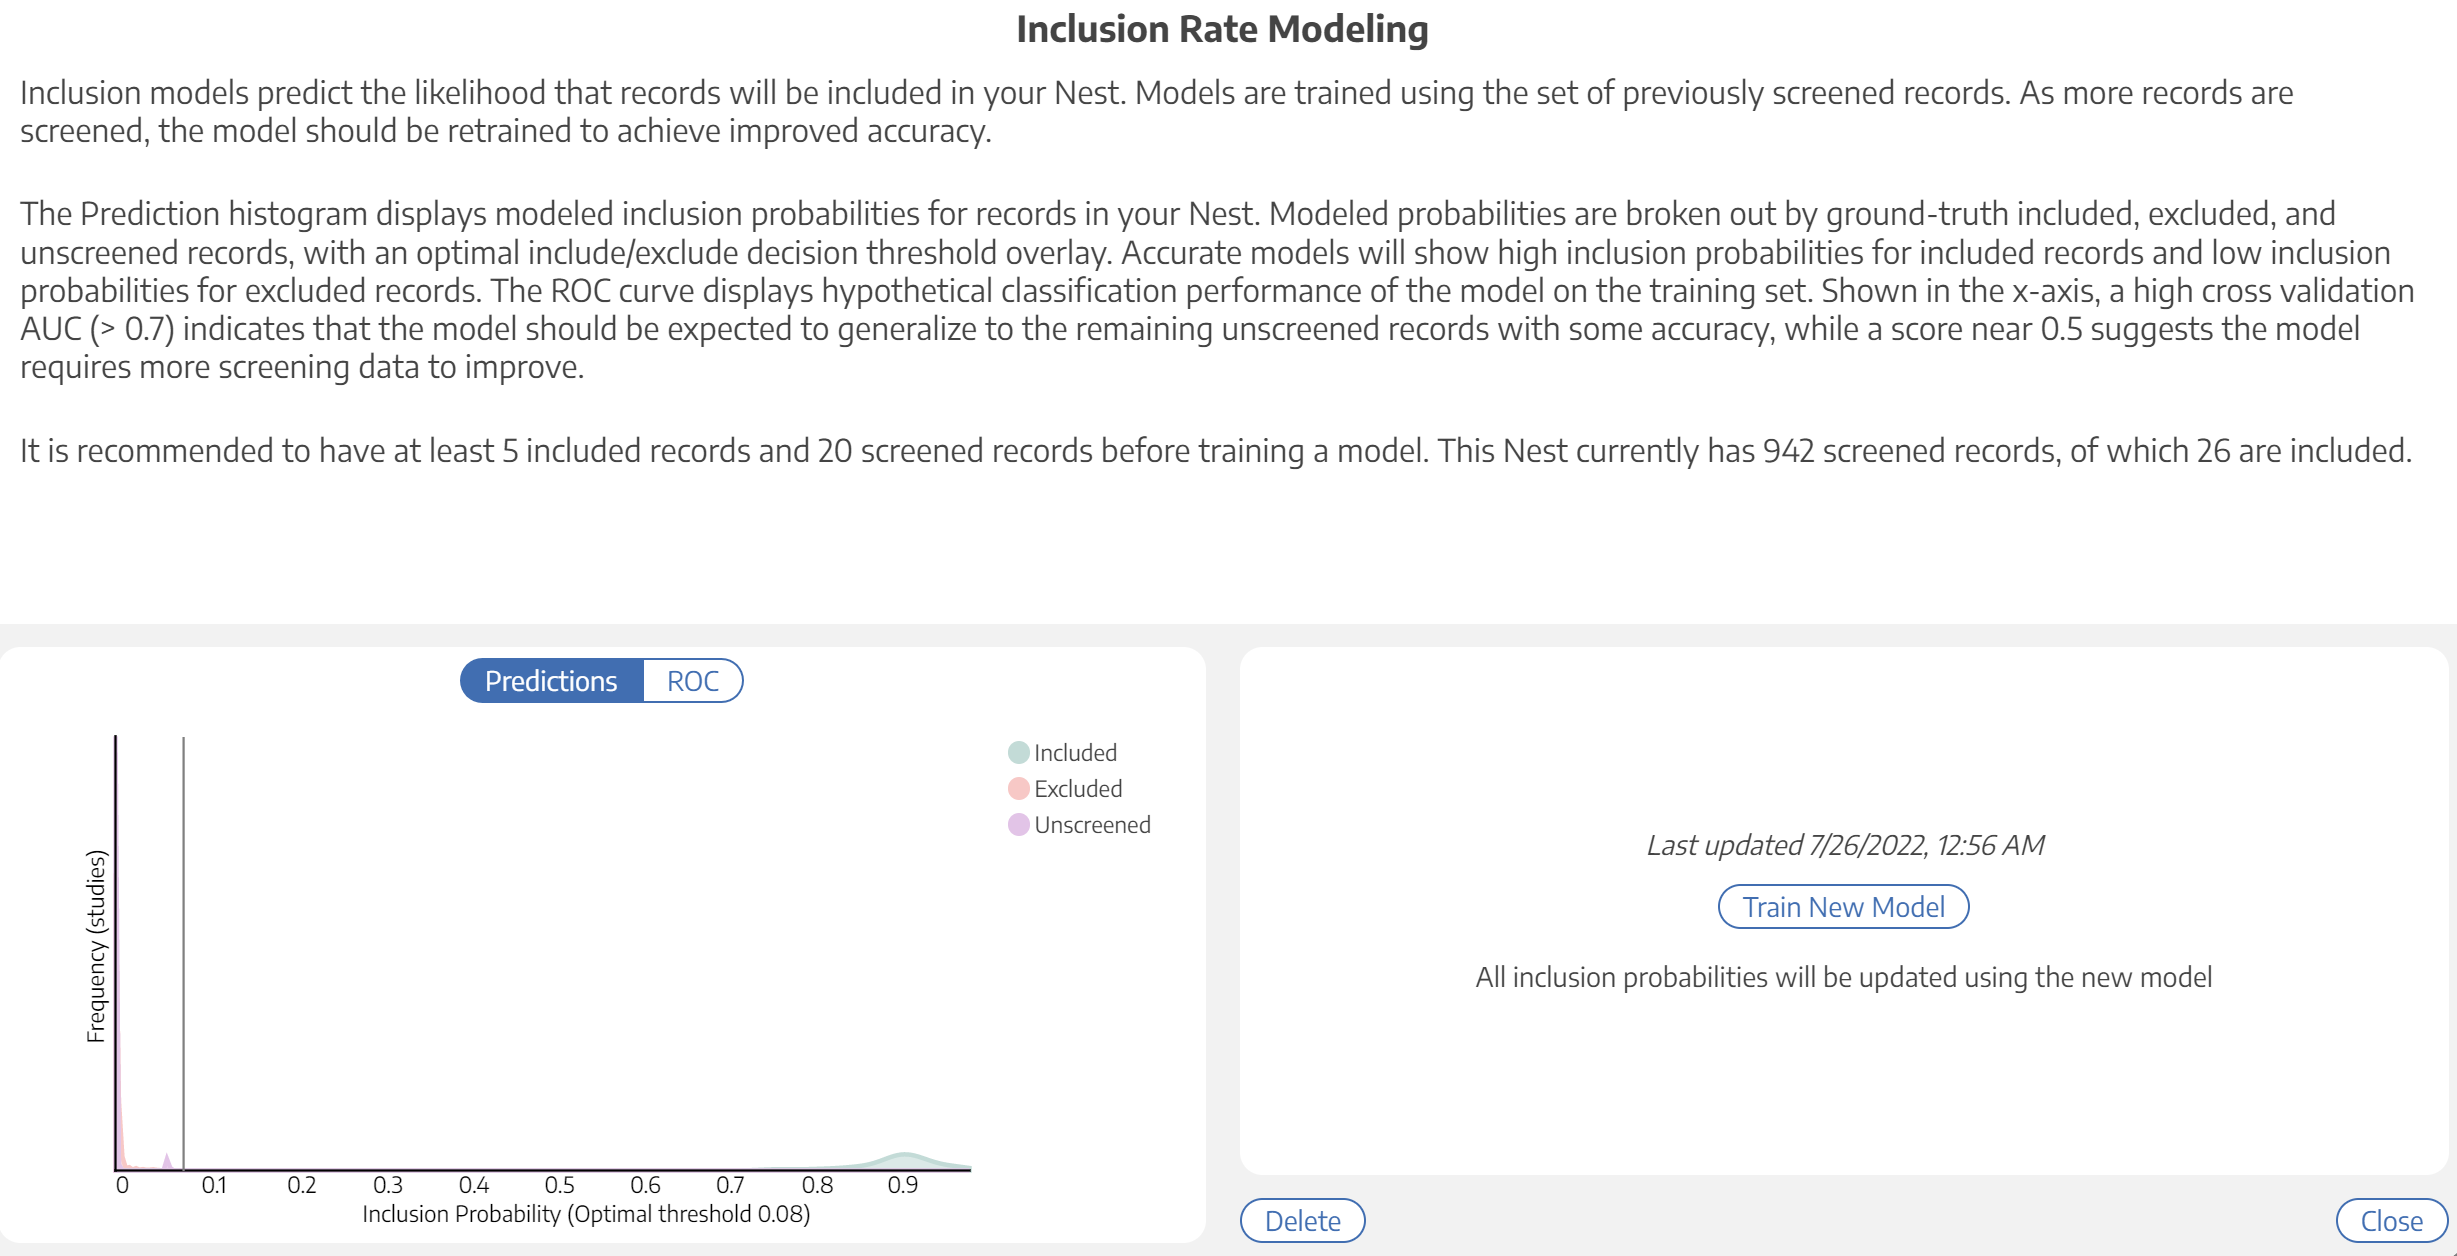
Once the modal opens, click “Train New Model.” It may take a minute to train, after which it will populate the histogram on the left.

Interpreting the Model

Once the Model is trained, you should see a histogram (red box) where Included, Excluded, and Unscreened records are represented by red, green, and purple curves, respectively:

Odds of inclusion are presented on the x-axis (ranging from 0 to 1).

What if there is not enough evidence to train the Model?

As noted in the modal, the Inclusion Prediction Model trains only on the decisions you and your team have made in that specific nest, so you must have screened at least 20 studies and included at least 5 to provide a minimum sample to train on.

If there is insufficient evidence to train the model, complete more screening until the “Train New Model” button becomes available.

How Accurate is the Model?

Since the Model is trained on a nest-by-nest basis, its accuracy ranges based on how many records it can train on and how many patterns it can find in inclusion activities.

You can see the accuracy in the modal (see red arrow in the image above). Accuracy is presented as a Receiver Operating Characteristic Area Under the Curve (ROC-AUC).

ROC-AUC has a minimum of 0 and a maximum of 1, where 1 indicates that when the Model checks its predictions on existing inclusion decisions, it had no false positives or negatives. So, high ROC-AUC (0.85-0.99) indicates that trusting the Model may be warranted, while lower ROC-AUC means that more screening may be necessary to train it further, or the patterns in inclusion decisions are too disparate for accurate prediction.

Implications for Screening

Once trained, the Inclusion Prediction Model will automatically re-order studies in Screening so that the most likely to be included are presented first. This assists in identifying relevant studies early.

Inclusion Prediction is also available as a filter in Inspector, which can assist with finding records based on their chance of inclusion. Bulk Actions can also be taken at your discretion, but ensure that you are careful in excluding studies if you have not reviewed their Abstracts at least!

wiki/autolit/screening/inclusionpredictionmodel.1668907269.txt.gz · Last modified: 2022/11/20 01:21 by nicole_hardy_alumni.brown.edu