Nested Knowledge

Bringing Systematic Review to Life

User Tools

Site Tools


wiki:guide:tips:digitize

Extracting Data from Images

Have you ever read a paper and realized that the data you need is in a figure, but you can't pull the exact number from it? Have no fear! You can actually digitize these figures to extract the data you need.

Prerequisites

R, RStudio, and the digitize package need to be installed beforehand. See this link for instructions on how to install R and RStudio. See this link for how to install packages.

Steps

  1. Save your high resolution figure as a .jpg, .png, .bmp, or .tiff in the same directory as your working directory in R.

    If you don't know where your working directory is, type getwd() in the console. This will spit out where your working directory is. To make sure the file is accessible, you can either change your working directory to be where the file is using setwd(), or you can save the file in the directory location specified by getwd().

  2. Load the digitize package in your R session.
  3. Type in digitize(“filename.filetype”) in the console, changing the file name and file type in accordance with how your file is saved on your computer.
  4. Once you do this, you will need to calibrate your x and y axes, respectively.
    1. On the x axis, select two clearly defined points where you have the exact values. Tick marks on the x axis would be great choices.
    2. On the y axis, select two clearly defined points where you have the exact values. Tick marks on the y axis would be great choices.
    3. Once you finish, you will see blue X's at the points you selected.
  5. Type each of the points you selected in the console, hitting enter after each one. In the example above, you would do the following: 0, enter, 24, enter, 8.5, enter, 12, enter.
  6. Click on all the data points you want the (x,y) values for, and click finish in the plot or hit ESC on your keyboard. You will see red circles over the points you selected.
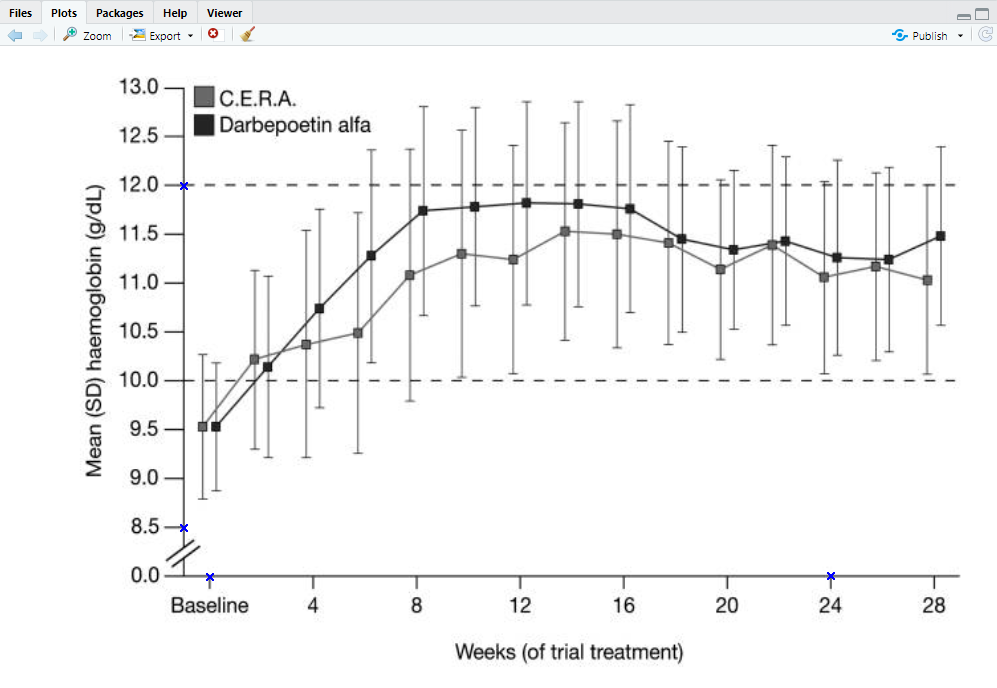
  7. In the console, the (x,y) pairs will be given.
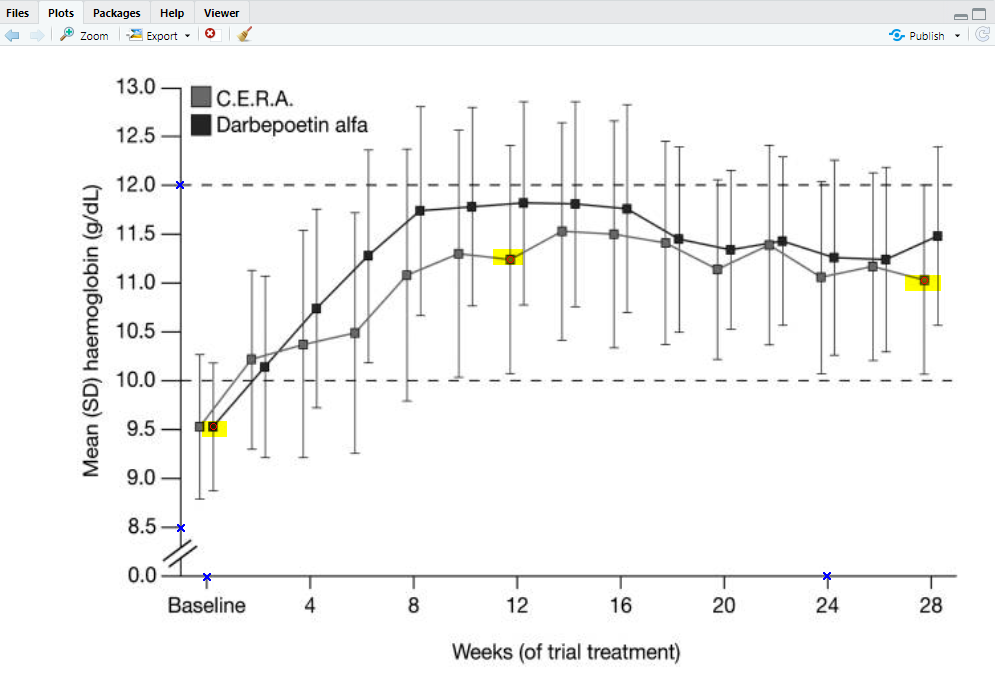
Always double check to make sure the values that R gives you align with what you're expecting.

Video Walk Through:

Check out this video! If it's blurry, go directly to the YouTube page to view it.

R Script:

#--------------------------------------------------------------
### Setting up workspace to be able to digitze graphs
#--------------------------------------------------------------
setwd("C:/Users/nhard/OneDrive/Documents")
install.packages('digitize')
library('digitize')

digitize("highres.jpg")
wiki/guide/tips/digitize.txt · Last modified: 2022/02/09 21:13 by nicole_hardy_alumni.brown.edu