AutoLit User Guide
Examining Results in Synthesis
Administrative Tools
Support and FAQs
How to Perform Systematic Review
How to Perform a Meta-Analysis
Best Practices for Writing Your Manuscript
Additional Tips for Making a Nest
AutoLit User Guide
Examining Results in Synthesis
Administrative Tools
Support and FAQs
How to Perform Systematic Review
How to Perform a Meta-Analysis
Best Practices for Writing Your Manuscript
Additional Tips for Making a Nest
Once your Nest is complete, the data will be viewable and you can export the data for analysis. NK's Synthesis feature allows you to view the data through Qualitative Synthesis and Quantitative Synthesis depending on the end goal.
Synthesis Home lists the Contributors and Description, and then enables you to access the nest outputs (Qualitative Synthesis, Quantitative Synthesis, and Manuscript, outlined in red below).
Methodological details and outputs (specifically, PRISMA and Risk of Bias outputs) can be accessed at the bottom of the Contributors listing, also outlined in black below.
Lastly, to navigate back to the AutoLit for that specific nest, click the white “AutoLit” button in the upper right of Synthesis Home. Unlike the blue AutoLit button in the top menu (next to your name), which takes you back to a listing of all of your nests, the white “AutoLit” button will take you to the AutoLit for the specific nest you are viewing. This button is only visible to users with AutoLit access to that specific nest.
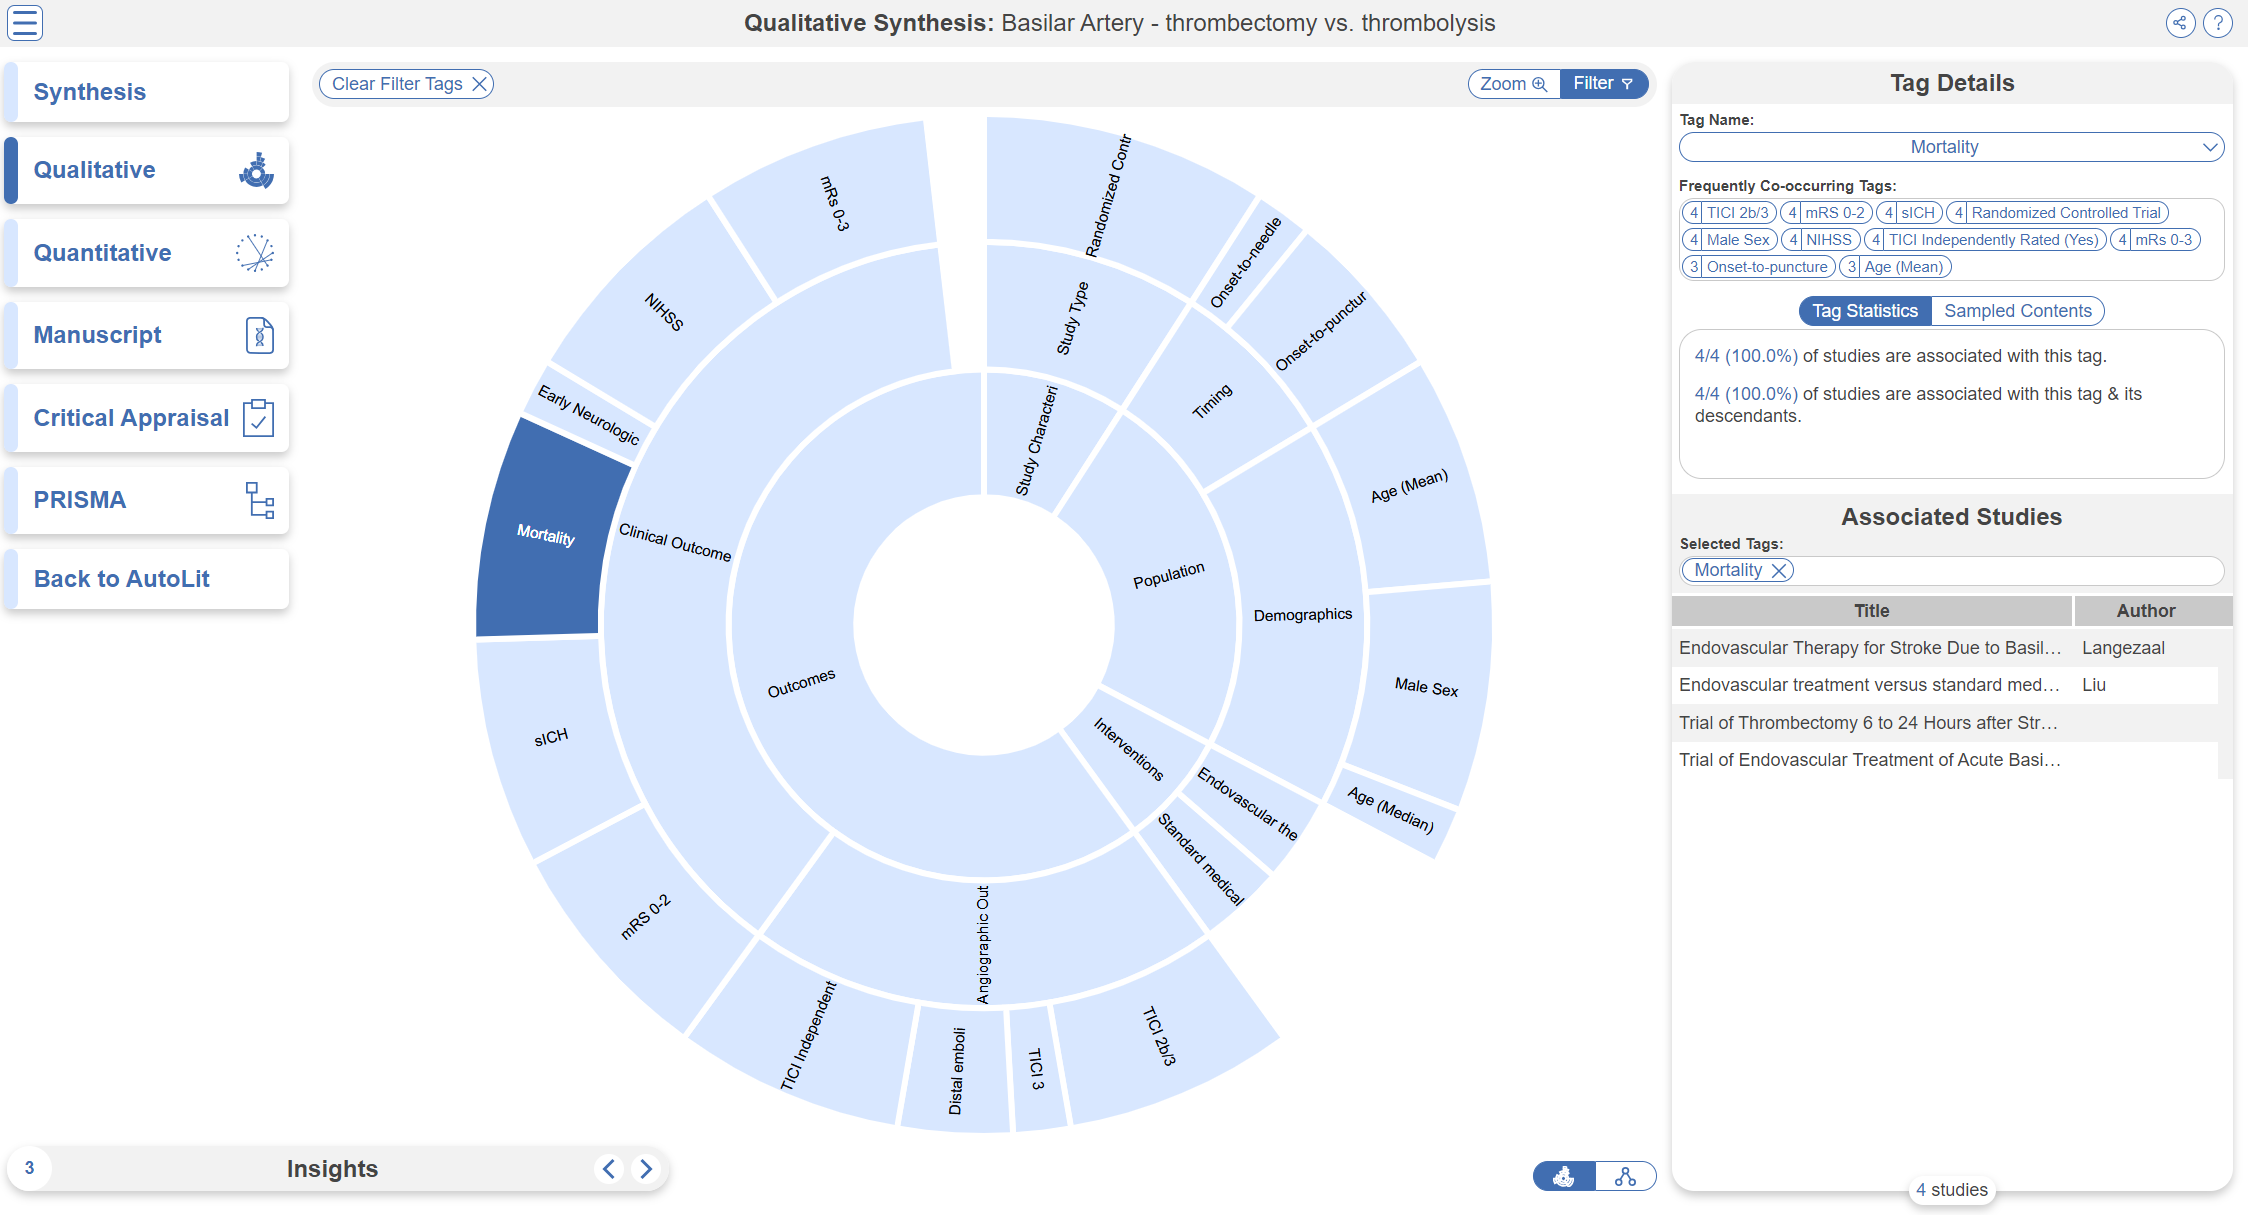
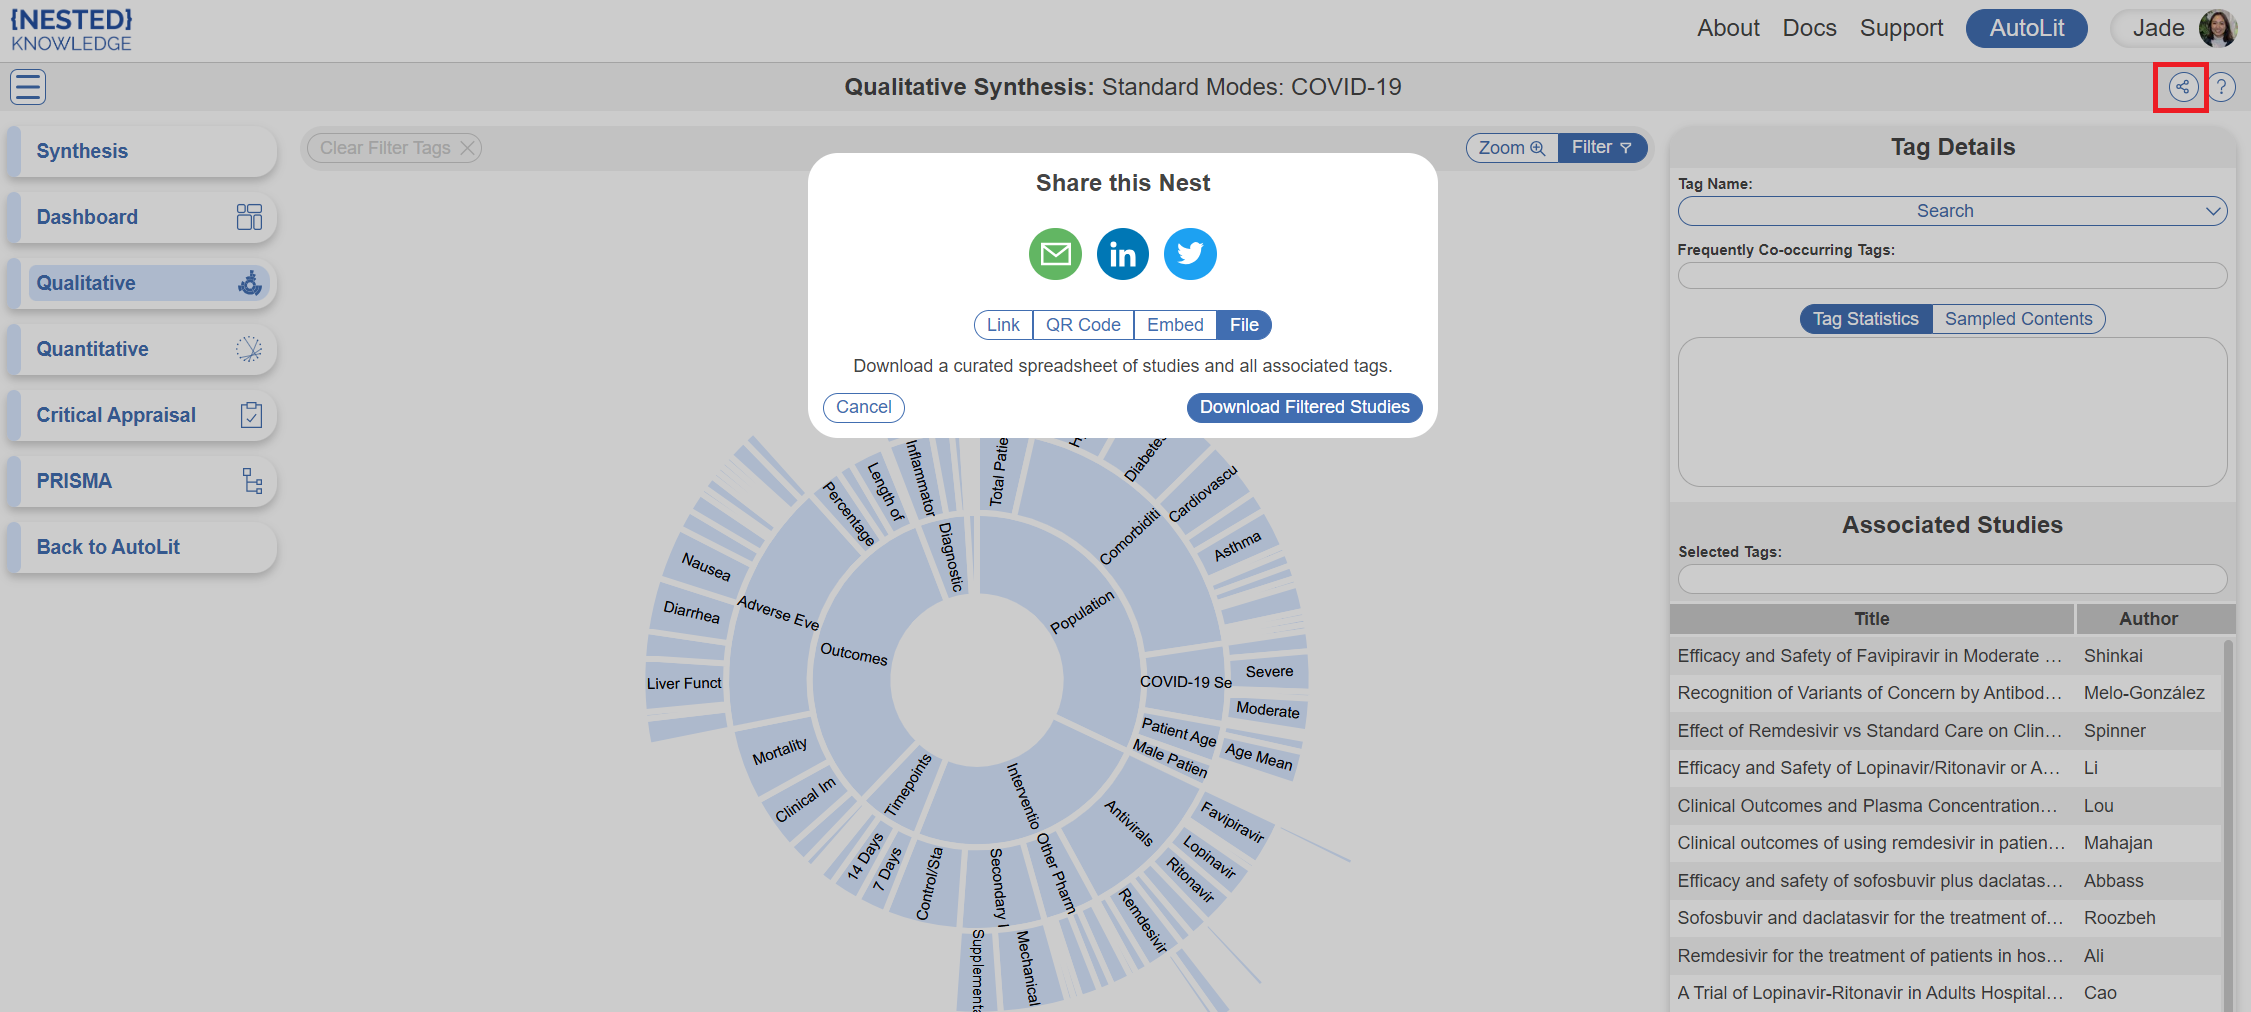
Here, you can examine the tags associated with studies in a nest in an interactive, filterable sunburst diagram (or dendrogram) with direct access to each study's abstract, data, and tags.
This page in synthesis will allow you to look at the data output from Data Extraction.
On Qualitative Synthesis (and, coming soon, on Quantitative Synthesis), specific Insights can be identified with a title, text, and pre-configured diagram!
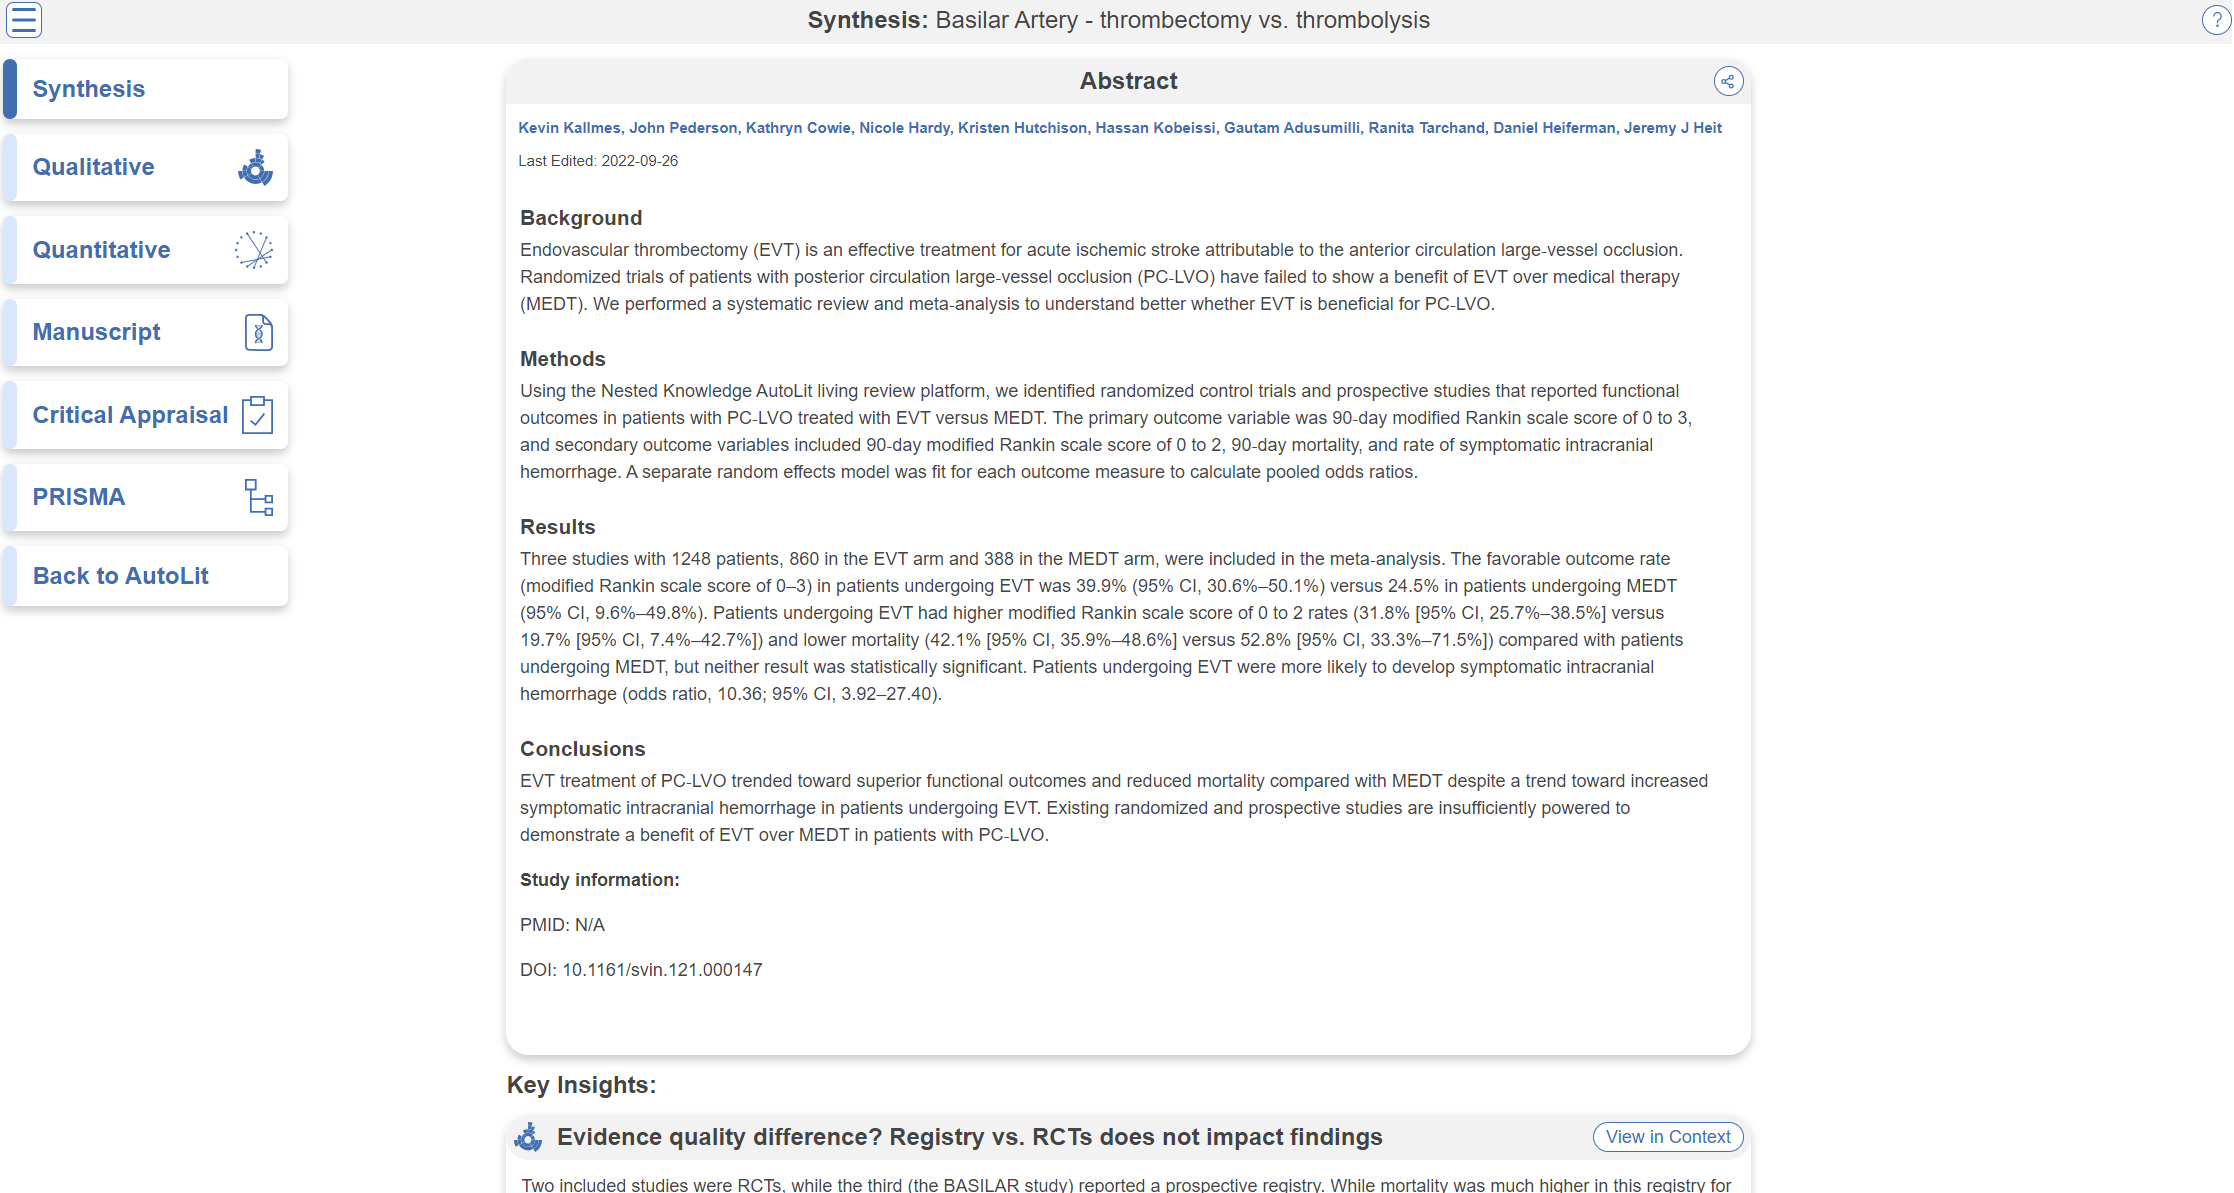
Manuscript presents written background, methods, findings, and discussion related to the nest.
Nested Knowledge also generates methods-related visuals automatically.
Specifically, a PRISMA Chart is generated to give a history of all Search and Screening activities.
An interactive Risk of Bias Visual page contains your Domain Distribution and Stoplight diagrams.
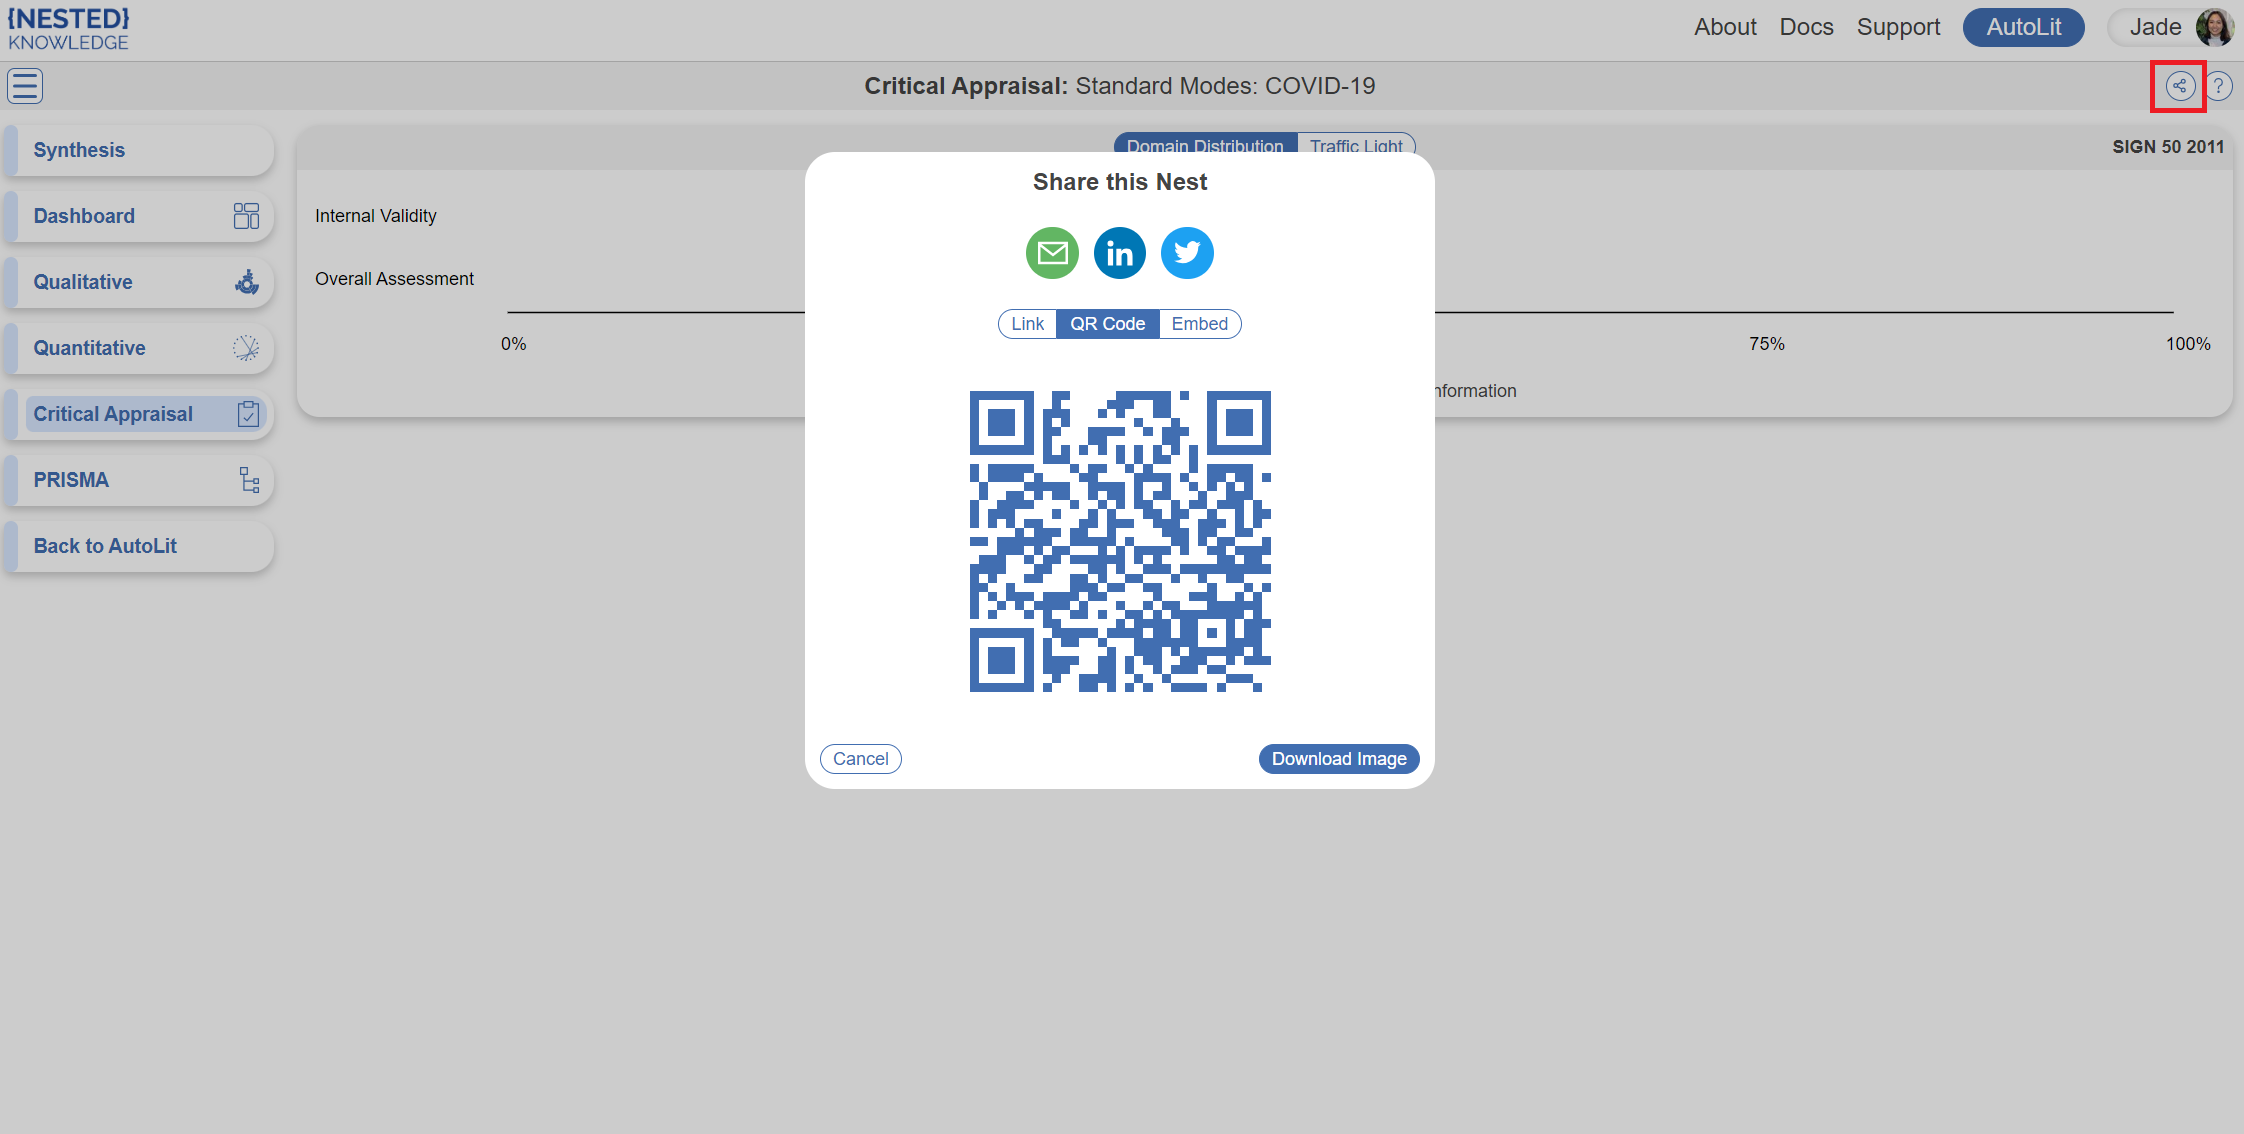
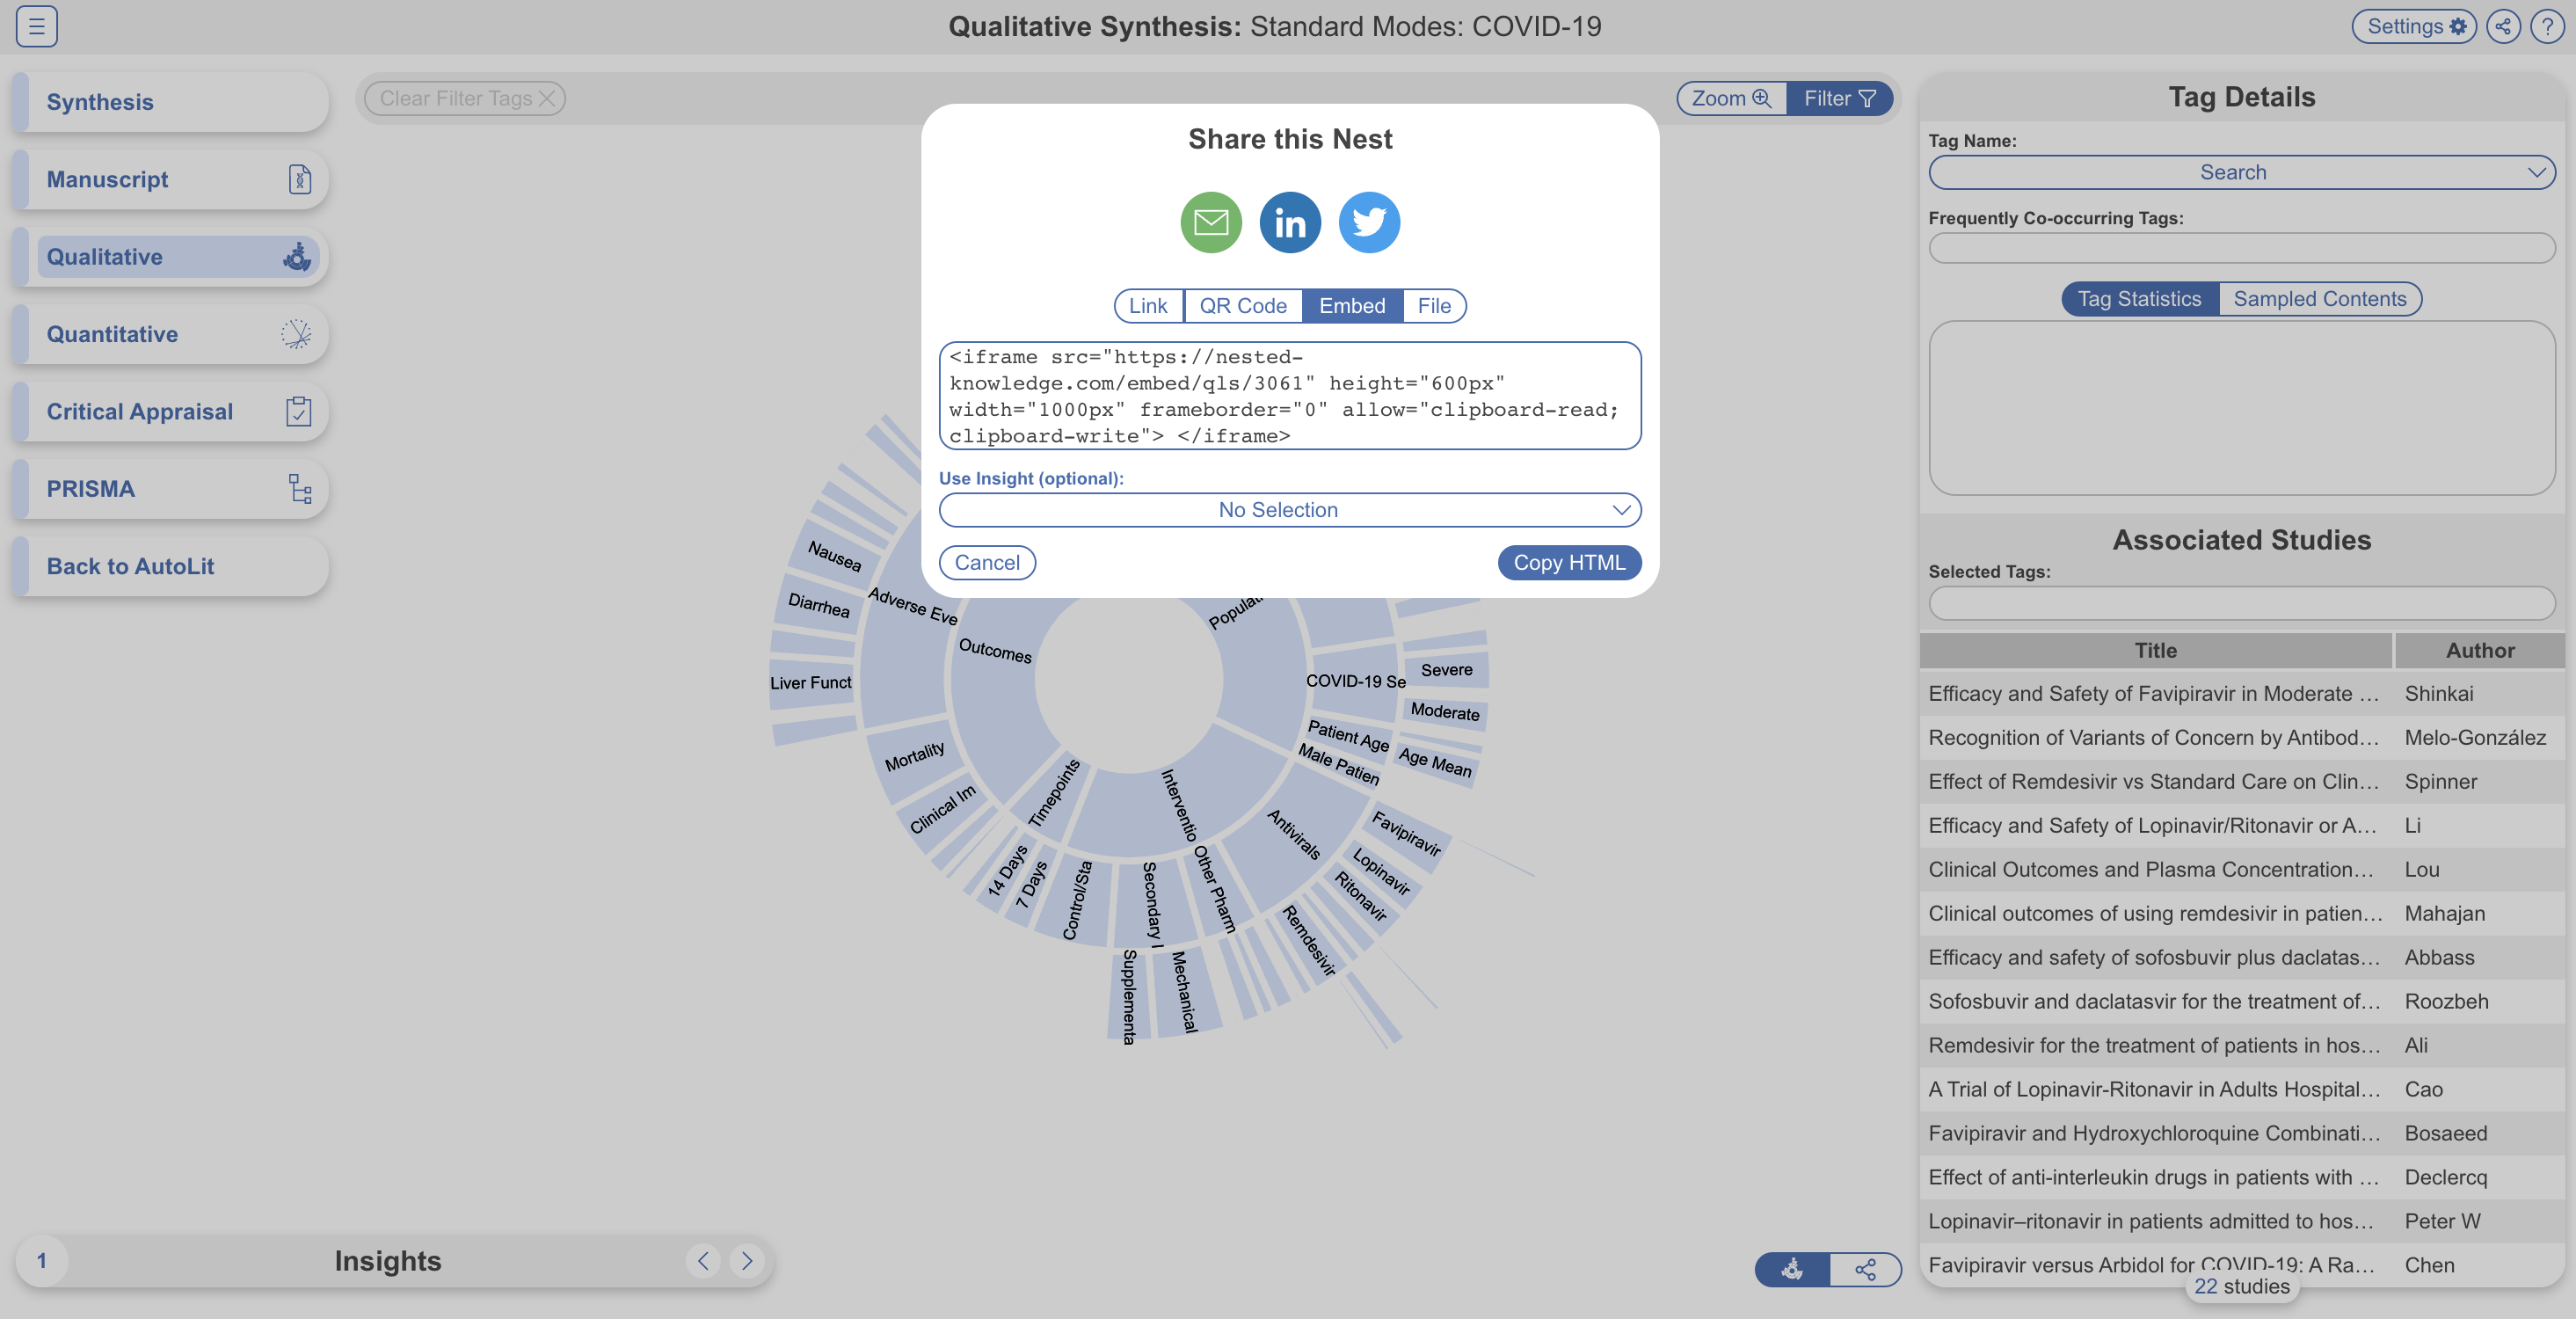
You can Link-share and Embed your Synthesis page(s) using the “Share” function: